

Bonnie’s Market Update 4/12/24
04/14/2024
It was a positive week, with ten of the eleven S&P SPDR sectors finishing higher. Communications (XLC) and Industrials (XLI) were the best sectors, while Health Care (XLV) and Real Estate (XLRE) were the weakest. The SPDR S&P 500 ETF Trust (SPY) was up +2.23%.
S&P SPDR Sector ETFs Performance Summary 3/15/24-3/22/24
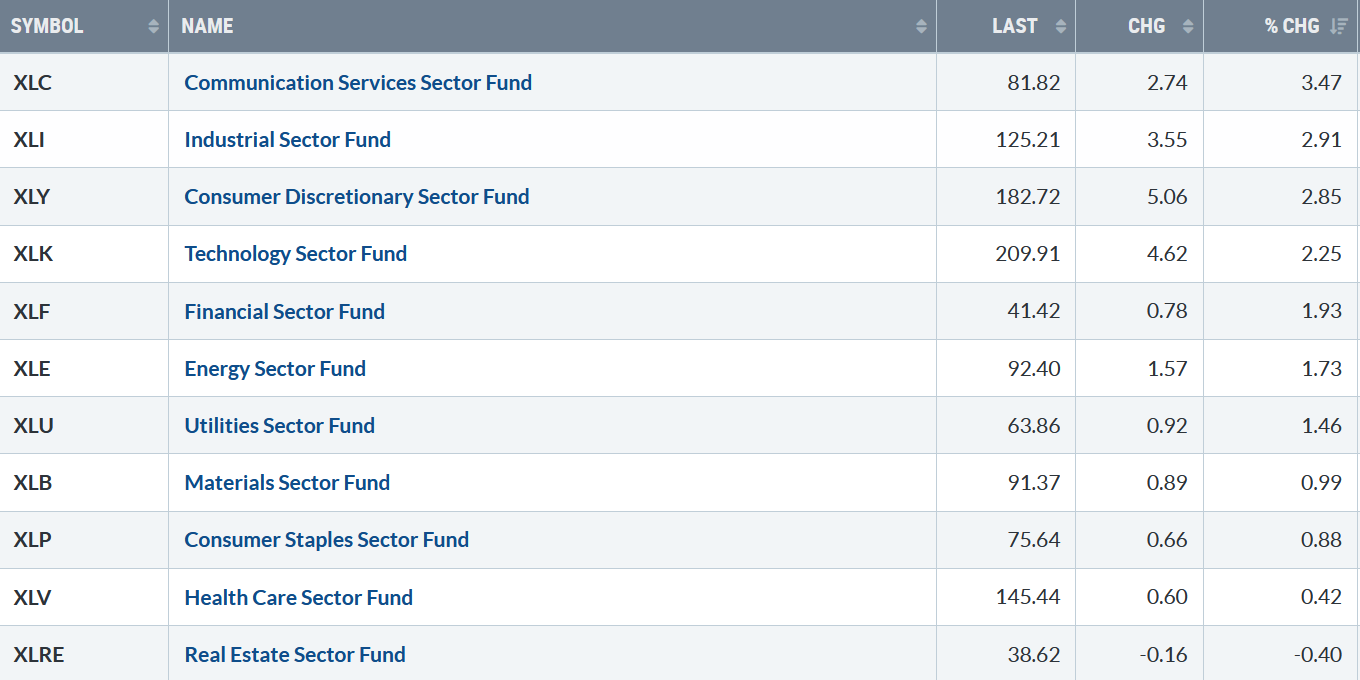
032224 SPDR Sectors
Source: Stockcharts.com
Figure 2: Bonnie’s ETFs Watch List Performance Summary 3/15/24-3/22/24
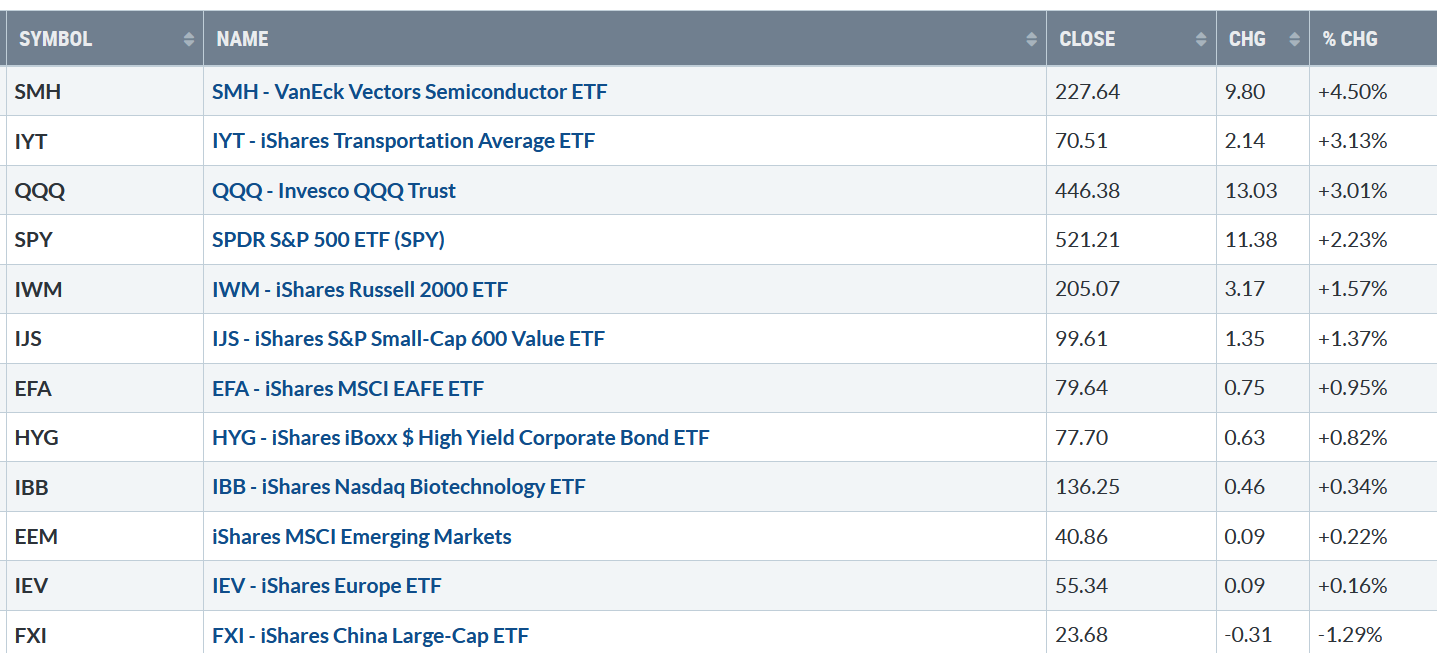
03224 Bonnie’s ETFs
Source: Stockcharts.com
After a few weeks of weakness, Semiconductors led the market higher and Transports gained strength. China lagged as global markets were weaker than the U.S.
Figure 3: UST 10YR Bond Yields Daily
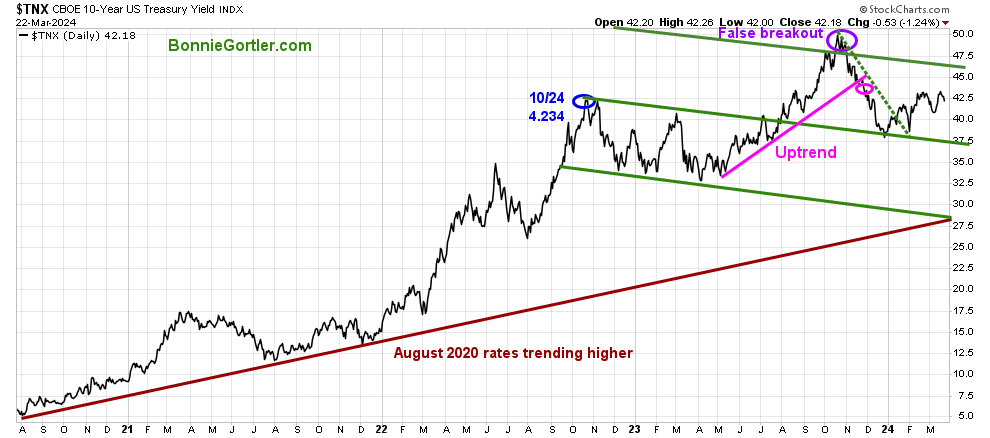
032224 UST 10 Yr Bo
Source: Stockcharts.com
The 10-year U.S. Treasury fell last week, closing at 4.218%. Falling yields will likely support further gains, yet unexpectedly sharp rising yields could cause selling pressure in U.S. Equities.
The major market averages were all higher last week. The Dow rose 1.97%, the S&P 500 gained +2.29%, and the Nasdaq was up +2.85%. The Russell 2000 Index participated in the rally, gaining +1.60%, but underperformed the other averages.
Figure 4: Weekly Value Line Arithmetic Average
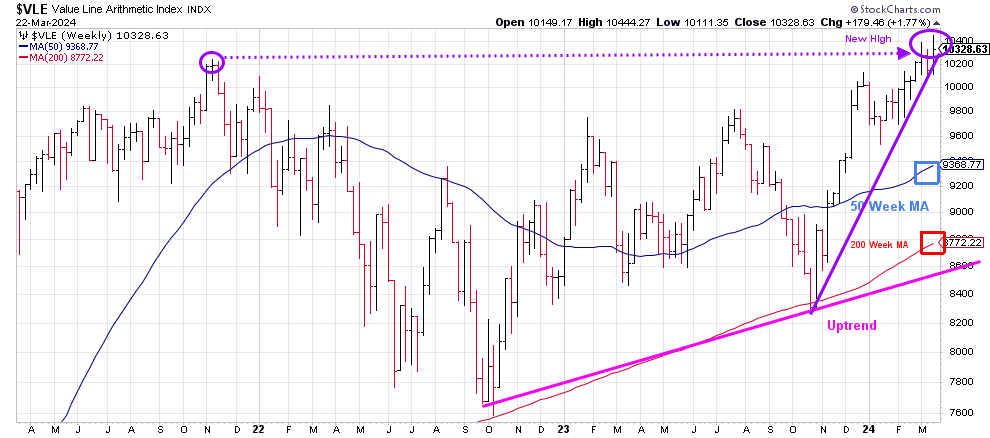
032224 VLE Weekly
Source: Stockcharts.com
The top chart is the weekly Chart of the Value Line Arithmetic Index ($VLE), which includes approximately 1700 stocks.
VLE rose +1.77% for the week, closing at 10328.63, remaining in an uptrend (pink line) from October 2022 but slightly breaking the uptrend from November 2023 (purple line) but closed above. VLE remains above the rising 50-week MA (blue rectangle), a key level I would like to see hold. As of this writing, it stands at 9368.77.
The first support is at 10000, followed by 9700 and 9300.
It will be short-term positive if VLE holds above last week’s low of 10111.35. However, selling pressure will likely increase if VLE closes below.
Figure 5: New York Stock Exchange (NYSE) New Lows
Weekly market breadth was positive on the New York Stock Exchange Index (NYSE) and for the Nasdaq. The NYSE had 2122 advances and 813 declines, with 590 new highs and 85 new lows. There were 2821 advances and 1790 declines on the Nasdaq, with 511 new highs and 304 new lows.
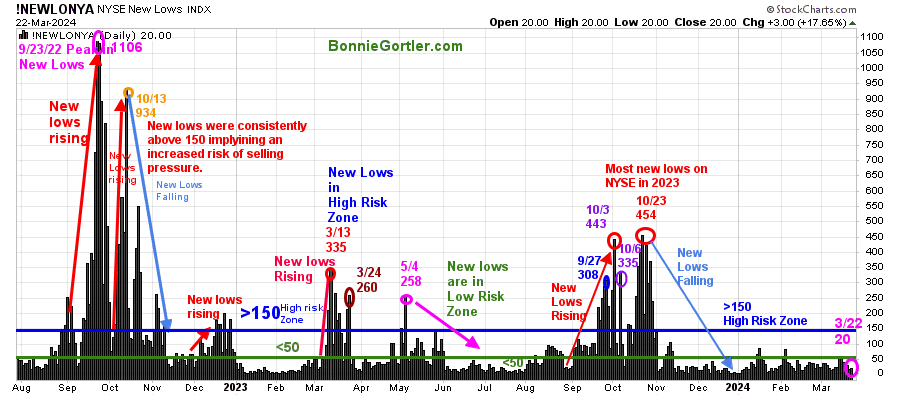
032224 NYSE New Lows
Source: Stockcharts.com
Watching New Lows on the New York Stock Exchange is a simple technical tool that helps increase awareness of the direction of an immediate trend.
For most of 2022, new lows warned of a potential sharp pullback, high volatility, and “panic selling,” closing above 150. The peak reading of New Lows in 2022 was on 9/23 at 1106, not exceeded in 2023.
Last week, New lows on the NYSE fell from 53 to close at 20 (pink circle), in the lowest risk zone. In 2024, New Lows have stayed below 150, a sign of a healthy market. A rise above 150 would be a warning sign of a market correction.
Learn more about the significance of New Lows in my book, Journey to Wealth, published on Amazon. If you would like a preview, get a free chapter here.
Figure 6: Daily New York Stock Exchange (NYSE) New Highs (3/21/24)
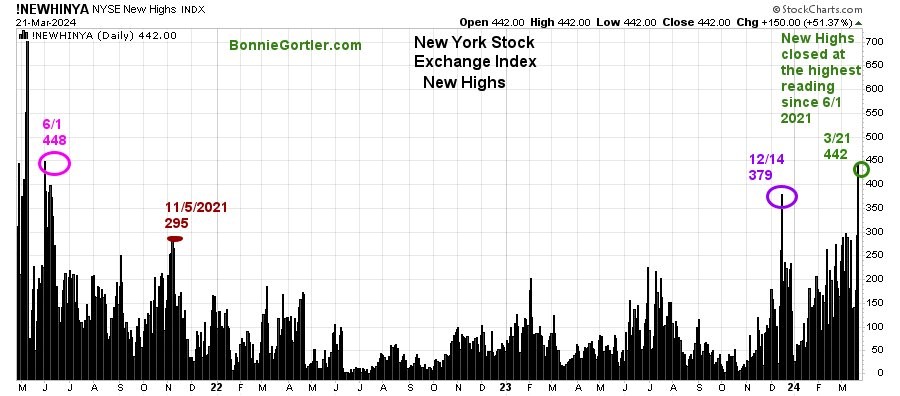
032124 NYSE New Highs
Source: Stockcharts.com
The chart above is a daily chart of the number of stocks making new 52-week highs on the New York Stock Exchange Index (NYSE). New highs hit 442 on 3/21, surpassing the 12/14/23 reading of 379, the best since 6/1/21 when there were 448.
Figure 7: Daily New York Stock Exchange (NYSE) New Highs (3/22/24)
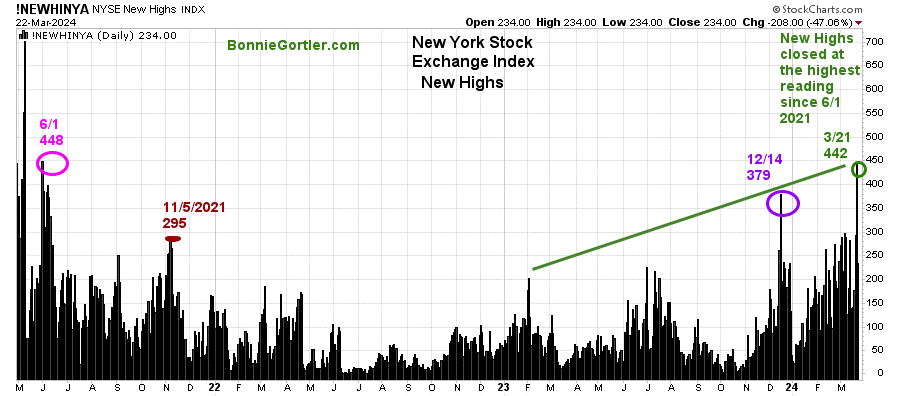
032224 NYSE New Highs
Source: Stockcharts.com
On Friday, 3/22, New Highs on NYSE contracted to 234 New Highs. Watch this week if New Highs expand, which would be bullish for the near term, or if they start contracting, a clue of potential short-term weakness.
A well-thought-out investment plan, good investment habits, and a strong money mindset will be the tools you need to meet challenges.”
~Bonnie Gortler
Figure 8: Nasdaq New Highs (3/21/24)
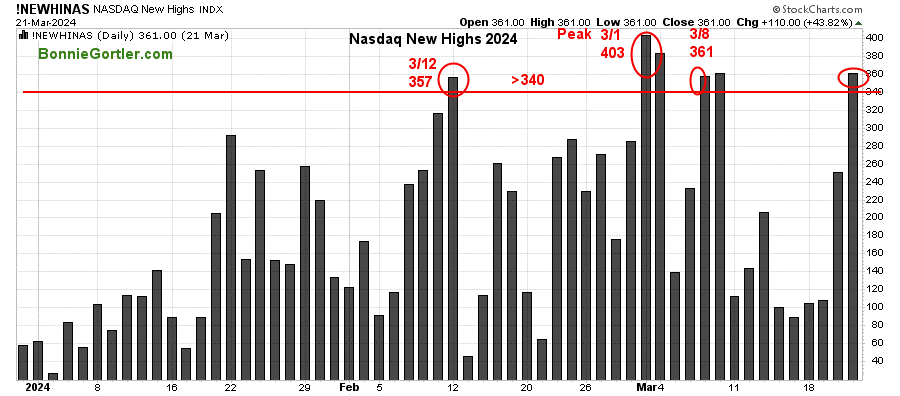
032124 Nasdaq New Highs
The chart above is a daily chart of the number of stocks making new 52-week highs on the Nasdaq. The number of stocks making new 52-week highs improved last week, hitting 361 on March 21, the same as 3/8/24 but below the peak of 3/1/24 of 403. If New Highs expand and get above 403, it would be a positive sign of the rally continuing to broaden.
Figure 9: Nasdaq New Highs (3/22/24)
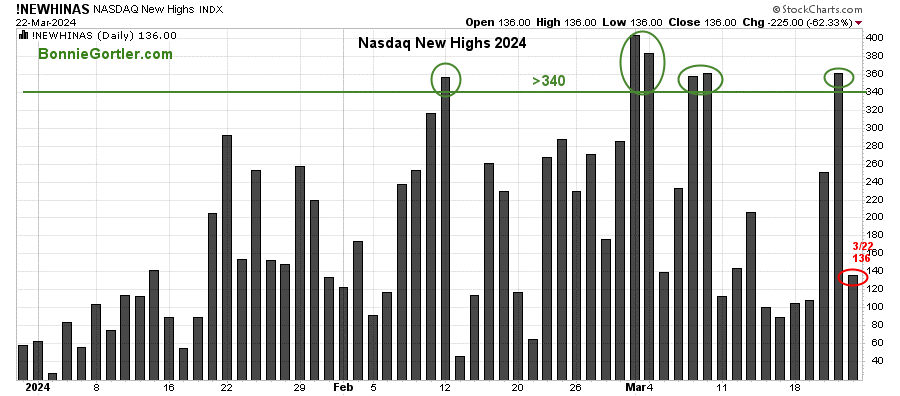
032224 Nasdaq New Highs
Source: Stockcharts.com
The number of stocks making new 52-week highs on the Nasdaq fell to close at 136 on 3/22, not yet exceeding the peak of 403. Time will tell if the Nasdaq has enough strength to resume higher to end the first quarter.
Do you want to go deeper into charting? Learn more in the comfort of your home today with my Free 33-minute Training, Charting Strategies to Cut Risk and Trade with the Trend. Sign up here.
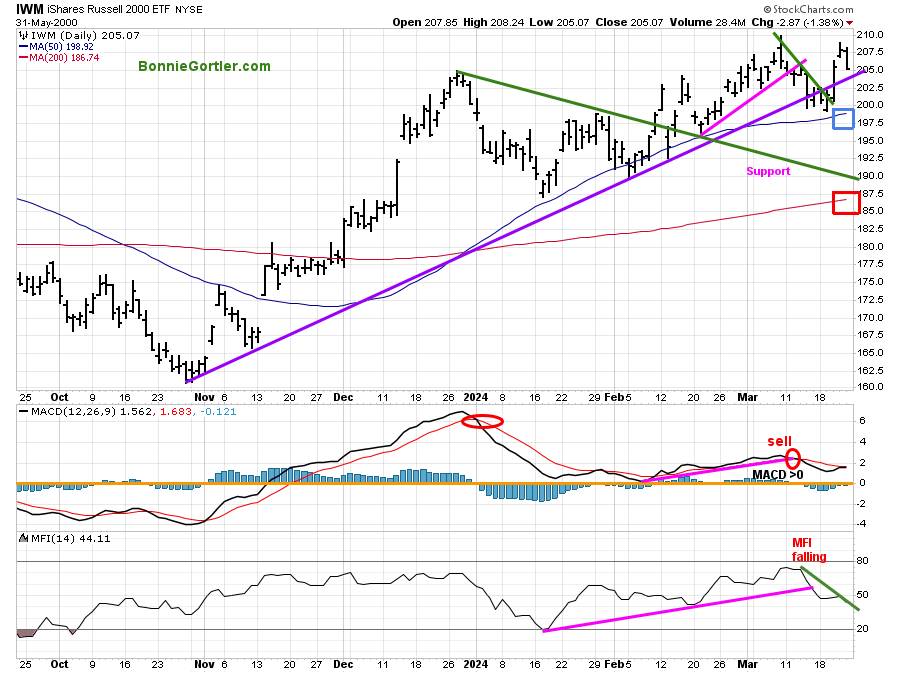
Figure 10: Daily iShares Russell 2000 (IWM) Price (Top) and 12-26-9 MACD (Middle and Money Flow (Bottom)
032224 IWM Daily
Source: Stockcharts.com
The top Chart is the daily iShares Russell 2000 Index ETF (IWM), the benchmark for small-cap stocks, with a 50-Day Moving Average (MA) (blue rectangle) and 200-Day Moving Average (MA) (red rectangle) that traders watch and use to define trends.
The uptrend from November 2023 was penetrated last week, but there was no follow-through to the downside and closing above. IWM closed above the uptrend, gaining +1.57%, but closed at its lows on Friday. IWM remains above both the 50 and 200-day MA. Two closes below the 50-day MA (198.92 as of this writing) would likely hit sell stops.
Support remains at 197.50, 190.00, and 187.50. Resistance is at 210.00.
MACD (middle Chart) remains on a sell, above 0 and rising.
Money flow (lower chart) turned down and broke the January uptrend (pink line) as investors moved away from small caps, now starting to turn up with no conviction.
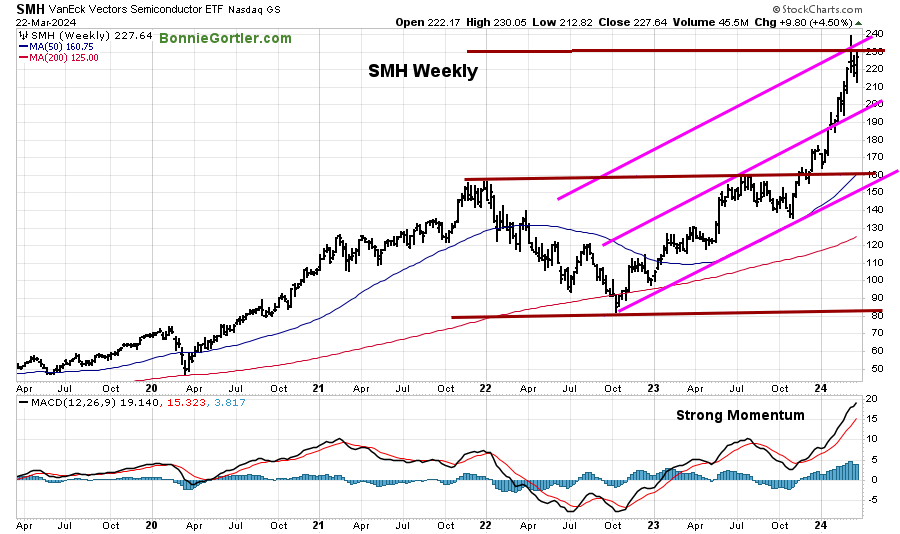
Figure 11: Weekly Semiconductors (SMH) (Top) and 12-26-9 MACD (Bottom)
032224 SMH Weekly
Source: Stockcharts.com
The top chart shows the Weekly Semiconductors (SMH) ETF, concentrated mainly in US-based Mega-Cap Semiconductor companies. SMH tends to be a leading indicator for the market when investors are willing to take on increased risk, and the opposite is true when the market is falling.
The Semiconductor ETF (SMH) rebounded, leading the market higher, +4.50% last week, closing at 227.64, after hitting the top of the weekly channel (top brown line) on 3/8, at 239.14.
Support is at 220.00, 210.00, 190.00 and 160.00. Resistance is at 230.00.
MACD (bottom chart) shows strong momentum, implying that the final top has not been made.
If SMH closes above 230.00 for two days, SMH will give new upside objectives towards 255.00 and 290.00. A weekly close below 190.00 would negate the upside objective.
Do you want more knowledge about the stock market? Learn how to implement a powerful wealth-building mindset and simple, reliable strategies to help you grow your wealth. Check out my eCourse Wealth Through Investing Made Simple Here.
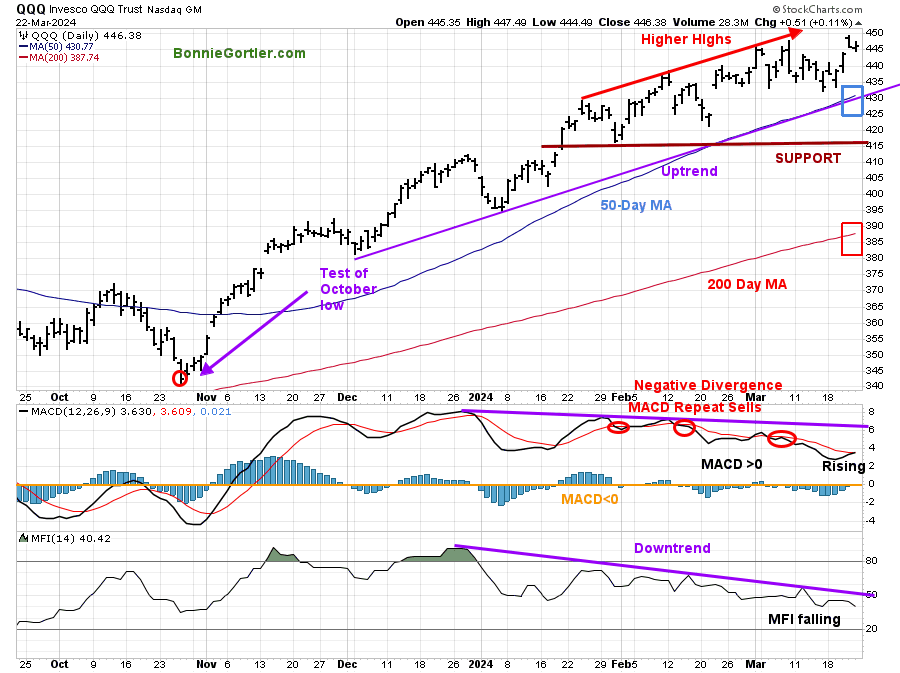
Figure 12: Daily Invesco QQQ Trust (QQQ) Price (Top) and 12-26-9 MACD (Bottom)
032224 QQQ Daily
Source: Stockcharts.com
The Chart shows the daily Invesco QQQ, an exchange-traded fund based on the Nasdaq 100 Index. QQQ made a low in October 2023 (red circle), followed by a successful retest of the low in early January 2024 and the start of an uptrend.
Last week, Nasdaq 100 (QQQ) closed at 446.38 +3.01%. QQQ remains above the rising 50-day Moving Average (blue rectangle) and the 200-day Moving Average (red rectangle), a sign of underlying strength.
Support is at 430.00, 416.00, 385.00. Two closes below 430.00 will likely increase selling pressure as investors lock in profits.
The bottom chart, MACD (12, 26, 9), remains on a sell, above 0, rising after giving repeat sell signals.
Money flow (lower Chart) remains in a downtrend and falling. It would be bullish if the downtrend breaks, implying investors increased interest in Technology stocks.
Despite QQQ showing signs of weakening momentum, QQQ continues to trend higher. as support levels remain intact.
Figure 13: The S&P 500 Index (SPY) Daily (Top) and 12-26-9 MACD (Bottom)
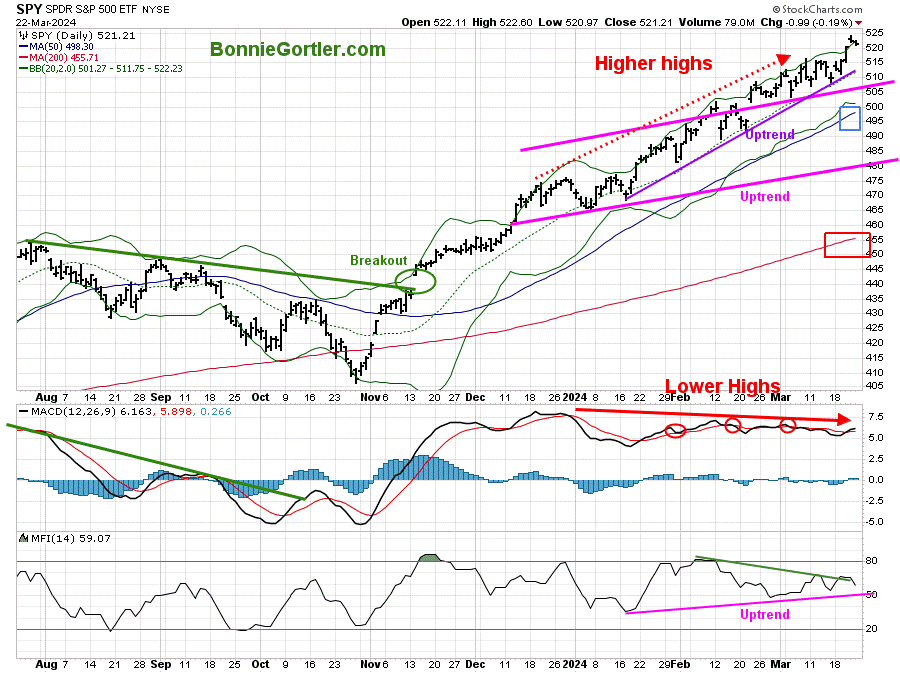
032224 SPY Daily
Source: Stockcharts.com
The S&P 500 (SPY) broke the downtrend in November 2023 (green solid line) and has been in a steady uptrend. The SPY accomplished its upside objective of 510.00.
The 2024 daily trend for the SPY remains up (purple line). The SPY closed at 521.21, up +2.23% for the week, remaining above the rising 50-day Moving Average (blue rectangle) and the 200-day Moving Average (red rectangle), a sign of strength.
Support is at 505.00, 491.00, 480.00, and 465.00.
MACD (bottom chart) remains on a sell above 0, rising and beginning to gain momentum after weakening. No fresh buy is possible with MACD>0.
It will be a positive in the short term if support at 505.00 holds and SPY closes above last week’s high of 524.11. On the other hand, a close below 505.00 could lead to stops hit, generating a sharp, quick decline.
Summing Up:
Selling pressure dissipated early in the week, propelling the major averages higher as support levels held as many stocks consolidated. Weakening momentum patterns are beginning to turn up from an extended position with market breadth improving. It’s positive that more stocks are making New Highs on the New York Stock Exchange Index and Nasdaq. Until support levels are violated, the bulls remain in control as the first quarter ends this week.
Remember to manage your risk, and your wealth will grow.
Let’s talk about investing one on one. You are invited to schedule your Free 30-minute Wealth and Well-Being Strategy session here or by emailing me at Bonnie@BonnieGortler.com. I would love to schedule a call and connect with you.
Disclaimer: Although the information is made with a sincere effort for accuracy, it is not guaranteed that the information provided is a statement of fact. Nor can we guarantee the results of following any of the recommendations made herein. Readers are encouraged to meet with their own advisors to consider the suitability of investments for their own particular situations and for determination of their own risk levels. Past performance does not guarantee any future results.


Create more wealth in your life
with these simple strategies.
As an added bonus you will also
receive BG’s Updates and Ezine

Discover how to quickly create more well-being in your life with these simple strategies.
As an added bonus you will also
receive BG’s Updates and Ezine

As an added bonus you will receive BG’s Updates and Ezine

All work listed on BonnieGortler.com is licensed under a Creative Commons Attribution - Noncommercial - No Derivative Works 3.0 Unported License.
