

Bonnie’s Market Update 4/12/24
04/14/2024
February was been the best month since October 2011 for the S&P 500 and also the best month for the Nasdaq Composite since January 2012. Similarly, US equity ETFs recently touched new highs before pulling back starting on March 6. The Nasdaq closed above 5000 for the first time in almost 15 years, generating optimism by investors. Celebrating the market making new highs is great for your emotions because it gives you a feeling of success, but a wise investor will not get emotional and will instead have a plan that includes flexibility with his/her money to make changes in their investments when the trend changes. Some sectors are extended, such as technology and health care, near their top of their channel after large gains, while other sectors are at key support areas, losing momentum and giving warnings to keep a close eye on your investments.
If you have been invested in oil, emerging markets, gold, silver which have been weaker sectors, then you might have a queasy stomach, with some fear that the market might be ready for a large correction. These areas are oversold (in a bottom area) for the long term, potential value exists because of their declines, but so far money doesn’t appear to be moving into these sectors. When a rally does take place the advance seems to fail quickly frustrating investors and no reward to speak of. On up days, there has been no significant volume so prices have stalled with investors selling into the rise. For a sign that these areas have bottomed, look for prices to rise with volume increasing on positive days, to signify that the trend has changed from down to up.
What Are The Charts Saying Now?-Utilities Select Sector SPDR ETF Weekly (XLU)
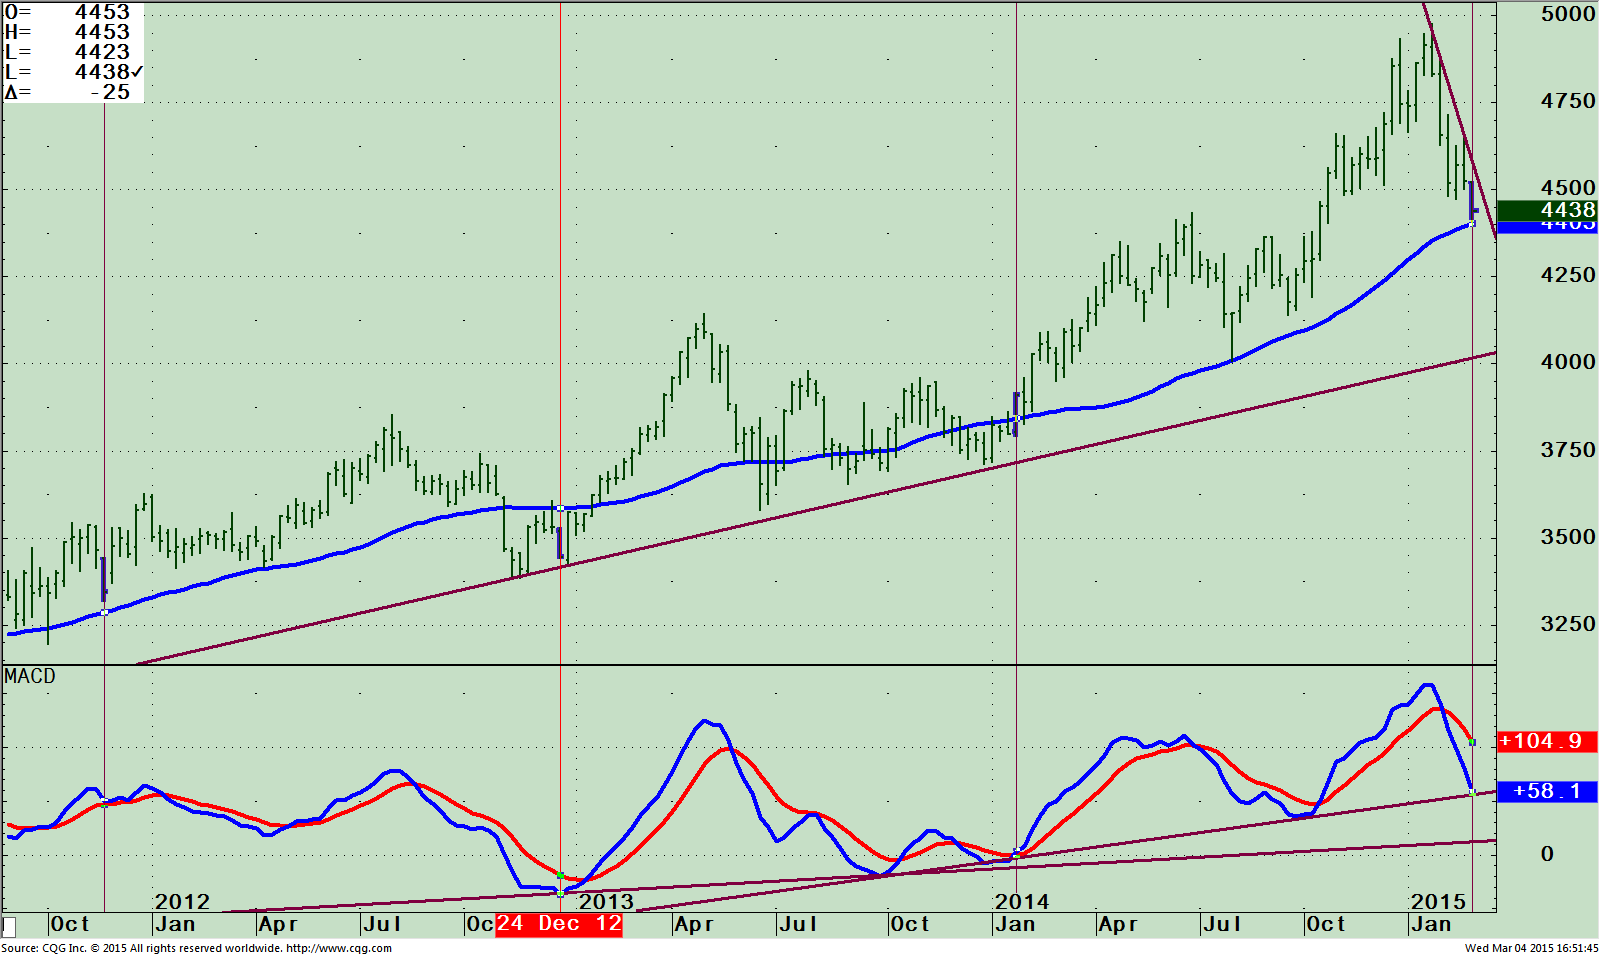
The top chart is the weekly Utilities Select Sector SPDR (XLU) that is in a uptrend from December 2012 with a 50 week moving average. The Utilities Index (XLU) for the most part provides companies that produce, generate, transmit or distribute electricity or natural gas. The top holdings as of 03/03/15 are Duke Energy Corp (DUK) 9.15%; NextEra Energy (NEE) 8.05 %; Dominion Resources Inc. (D) 7.49%; Southern Co. (SO) 7.35%; Exelon (EXC) 5.13%; and American Power (AEP) 5.04%.
XLU has quickly fallen from 48.76 on January 28th to a low of 44.05, (at the time of this writing) down 9.66% with the fall stopping just above the 50 day moving average which is acting as support at 44.38. There is a possibility the decline could be coming to an end soon because the XLU could have the support of being at a cycle low.
Notice the vertical lines, the bottom late in 2012 and early January 2014. If the Fed doesn’t raise interest rates in June and waits until later in the year or next year there is a good chance the XLU will turn up from here. The weekly downtrend would be broken to the upside if the XLU can close above 45.00. I would expect a rally to 47.OO and then stall, some base building with investors
looking for more clues to when rates will actually be raised.
The lower portion of the chart is the technical indicator MACD which measures momentum. MACD made a new high with price, confirming the high. The rally was so strong MACD failed to give an advance warning before utilities fell by forming a negative divergence. Now there are two significant trend lines in MACD to watch that could give further evidence if the XLU is a buying opportunity or if the cycle will fail and further weakness will occur. The uptrend from October 2013 remains in effect, but barely. The uptrend from 2012 looks like it will hold unless prices fall sharply.
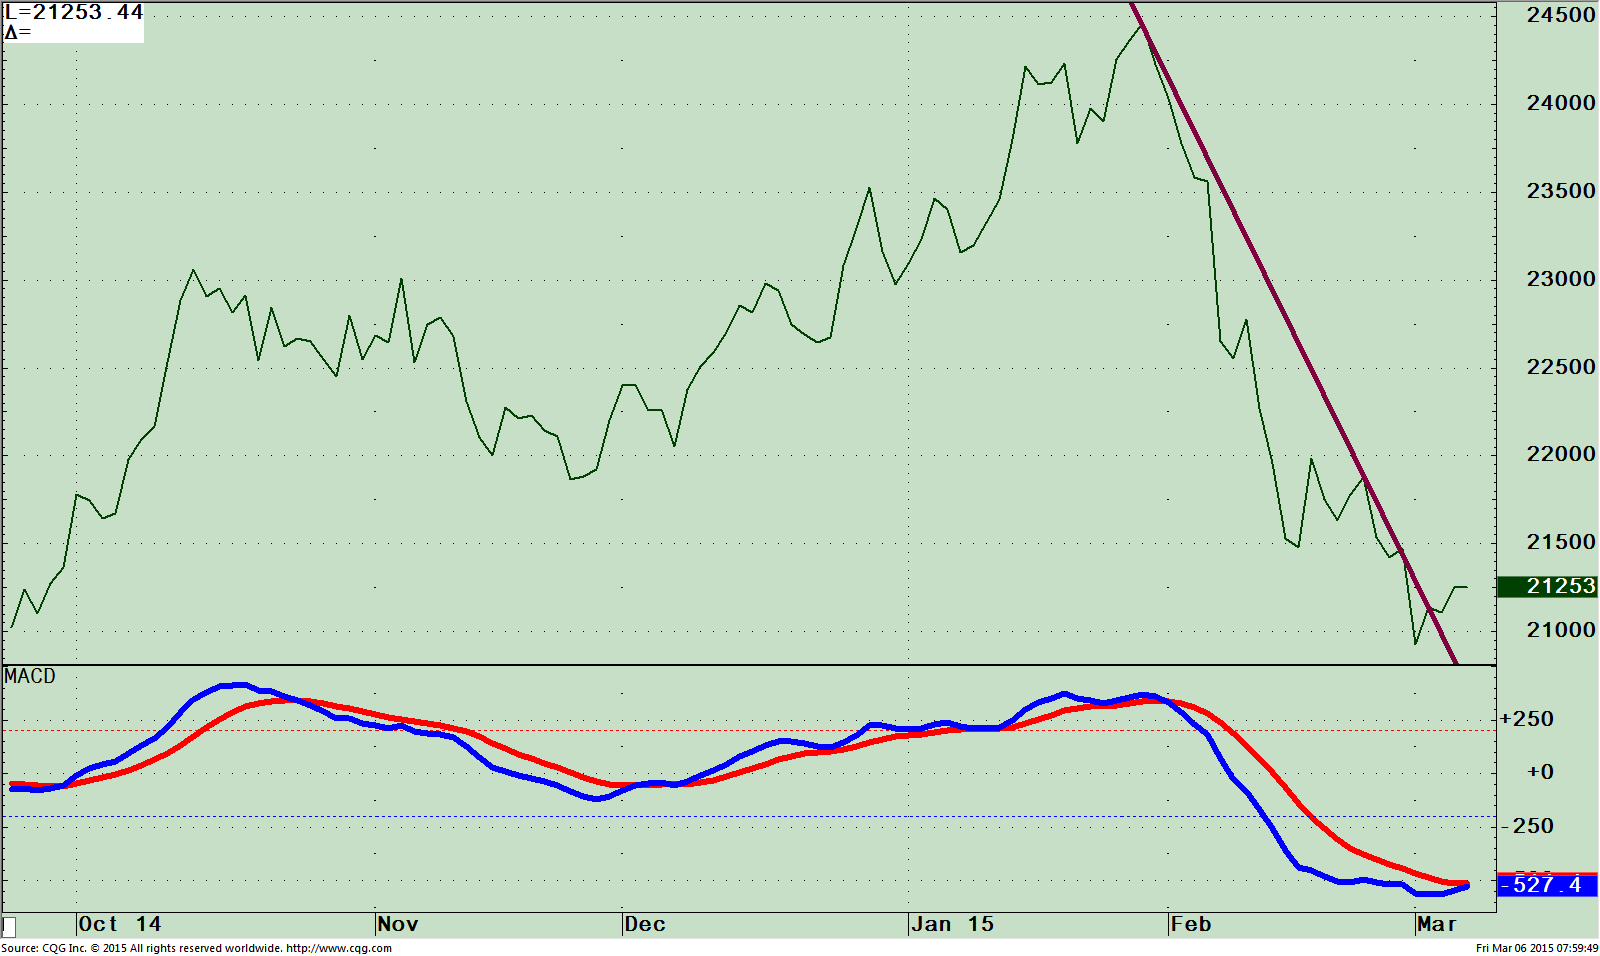
Daily XLU/SPY Ratio (Top) MACD of XLU/SPY Ratio (Bottom)
The top part of the chart shows the Daily XLU/SPY relative strength ratio. Utilities are stronger when rising and weaker than the S&P 500 (SPY) when falling. XLU peaked in 01/29/15 and fell in February. The downtrend has been broken, which is another sign utilities could be near a bottom. In addition, the MACD of the XLU / SPY ratio (lower part of the fi gure) has flattened and started to rise from a very oversold position. Since this is a daily chart weakness in utilities would turn down the ratio down but with the potential cycle bottom discussed above, I am looking for prices to stabilize.
Just To Sum Up:
With the expectation of higher interest rates, investors moved out of utilities, bucking the upward trend of the US stock market in February. Technical indicators have worked off their overbought conditions and have moved into a more favorable position after the February decline in utilities, including a potential cyclical bottom that could be at hand supporting the sector. To confirm that utilities have potentially bottomed and represents a buying opportunity, look for XLU to close above 45.00. This would break the weekly downtrend and would be bullish for the overall stock market.
I invite you to share your insights by calling me at 1-844-829-6229 or Email me at bgortler@signalert.com with your questions or comments.


Create more wealth in your life
with these simple strategies.
As an added bonus you will also
receive BG’s Updates and Ezine

Discover how to quickly create more well-being in your life with these simple strategies.
As an added bonus you will also
receive BG’s Updates and Ezine

As an added bonus you will receive BG’s Updates and Ezine

All work listed on BonnieGortler.com is licensed under a Creative Commons Attribution - Noncommercial - No Derivative Works 3.0 Unported License.
