Wait For the Dust to Settle: A Safer Entry In 3-6 Weeks
Many stocks finished October down for the month. The weakness extended early in November where the S&P 500 index was down 9 consecutive days with concerns about the outcome of the presidential election. A two day bounce followed, alleviating the oversold condition that was created. As the votes were gathered investors were nervous and the overnight futures were down sharply suggesting a lower opening on Wednesday. During the night, Donald Trump was named president. The panic was gone by the time the market opened.
Many market averages rallied strongly off their lows. There was a split market. Sectors such as Health and Finance moved higher, and other sectors were under pressure such as Utilities, Emerging Markets, Consumer Staples and Real Estate. Many investors, institutions and hedge funds were surprised by the outcome and had to change their investments quickly, or decide they wanted to be invested now that the election was complete. It’s still early to forecast what is ahead. Our trading models are in a neutral positive condition entering the most favorable seasonal period of the year, suggesting downside risk is limited.
You can expect more wide intraday trading swings in the market until the dust settles. This could take some time. A test of the lows over the next 3-6 weeks would be a safer buying opportunity if investors shift from buyers to seller.
What to Monitor Now for a Safer Entry
- Monitor overseas markets to see if they move higher than 11/09/16 close. Watch the following international ETF’s, Ishares China (FXI), Emerging Markets (EEM) and Mexico (EWW).
- Look for intraday trading swings to be less than 1% in the S&P 500 (SPY) and Russell 2000 Small Cap Index (IWM).
- Long term interest rates stop rising. Watch TLT iShares Barclays 20+ Yr. Treasury Bond (ETF).
- High Yield Bond Mutual Funds turn up and take out their recent highs. Use (HYG) or (JNK) as a benchmark.
- Momentum in intermediate and long term charts to turn more favorable, strengthening instead of weakening.
- An improvement in market breadth daily and on a weekly basis.
- Watch to see if the technology sector becomes a leader over the S&P 500. Watch the Nasdaq 100 (QQQ) and the Semiconductors HOLDR (SMH). Also keep an eye on Apple, which has been under some selling pressure the past few weeks.
- When the market declines notice the movement in VIX (an index that measures fear). Look if VIX accelerates quickly or it moves up quietly. When the market falls it would be a bullish sign if VIX moves lower.
The SPDR S&P 500 (SPY) Weekly Price And Channel

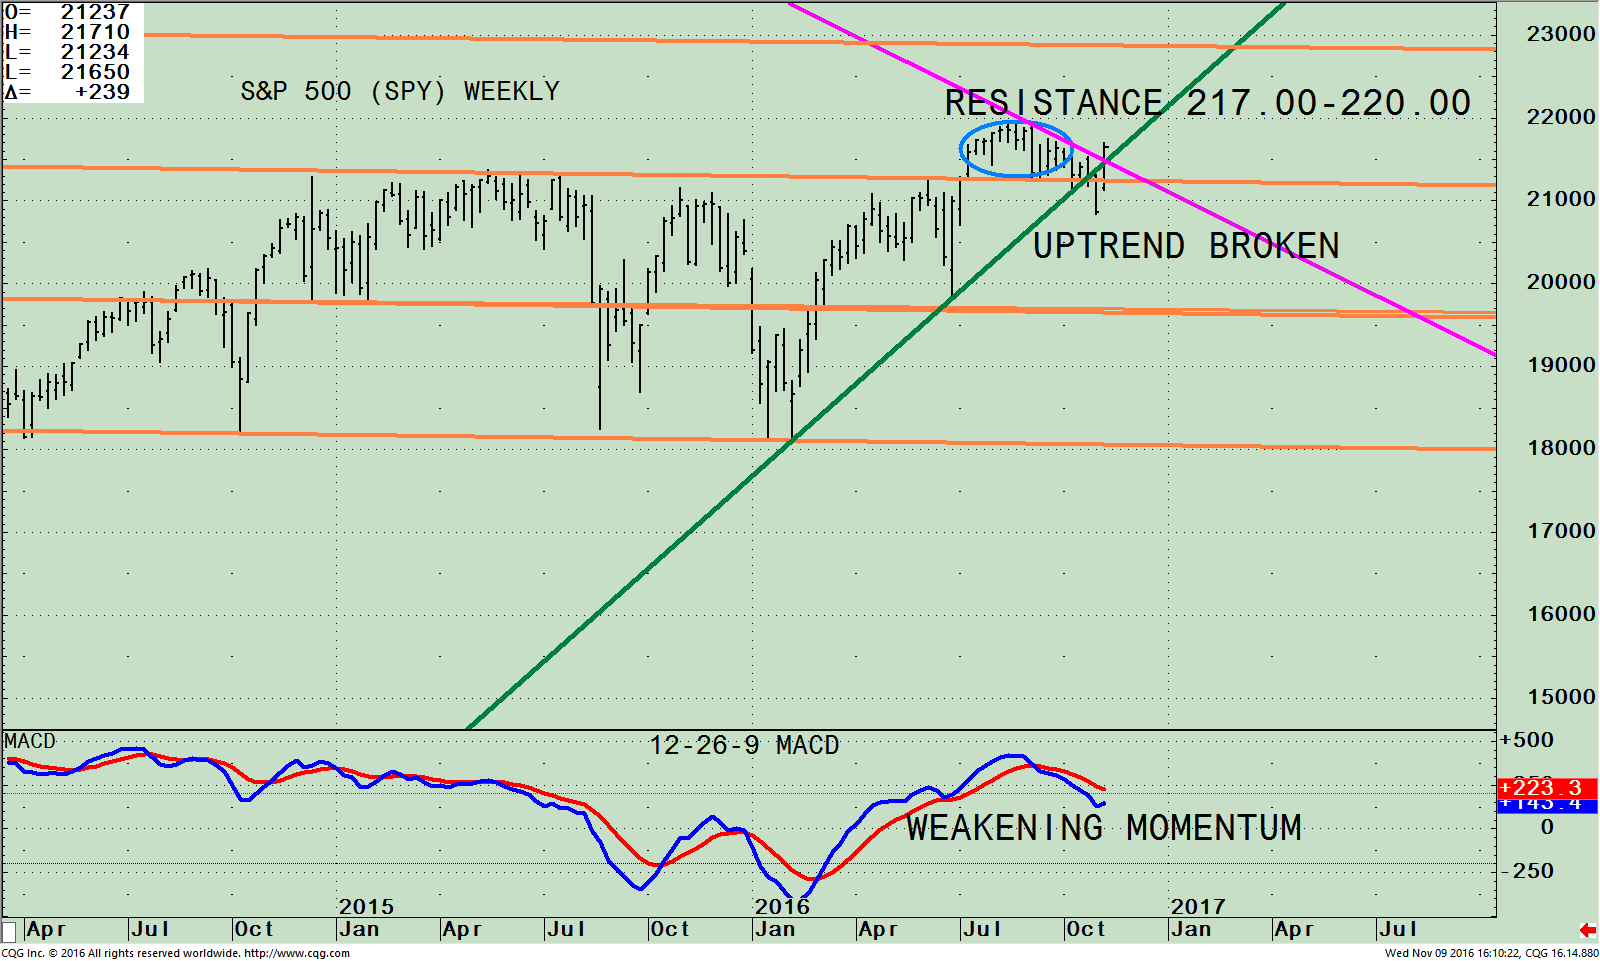
The chart above is the weekly SPDR S&P 500 (SPY) ETF that is comprised of 500 stocks of the largest companies in the U.S. The S&P 500 (SPY) broke below its trading channel breaking the uptrend (green line). The SPY looked like it would go lower however; there was no follow through to the downside and after the election reversed sharply higher.
What a difference a few days can make. An explosive rally developed after making a low during the night of the presidential election, the S&P 500 (SPY) closed at 216.50 on 11/9/16. The SPY is in the process of testing resistance between 217.00 and 220.00 from July 2016 highs (blue circle). If the S&P 500 (SPY) can get through resistance, it could potentially go to the upper channel at 228.00. If the market turns down, support is at 214.00 followed by 212.00 and 197.00.
The lower portion of the chart is the 12-26-9 MACD, a measure of momentum. It was a good sign MACD confirmed the high in July before generating a sell suggesting another attempt at the high would be made. Momentum has stopped accelerating downwards, and has started to flatten, both good signs. Notice however that MACD is not in an oversold condition where major bottoms take place. If the S&P 500 (SPY) does rise and break out to a new yearly high and touch the upper channel, there is a good chance MACD will not confirm and form a negative divergence.
Summing Up:
Investors’ perception changed quickly from bearish to bullish after the election upset by our new President Donald Trump. The S&P 500 (SPY) rose sharply and is again challenging resistance at 217-220 area. The upside target for the S&P 500 (SPY) is 228.00. Intermediate momentum indicators are not in position for a major bottom and not likely to confirm the recent strength, therefore upside potential could be limited once the dust settles. Stock selection is very important now, as the market is split. Investors are moving out of defensive sectors, market breadth is weak and new lows are increasing. More wide intraday swings are expected to continue. I recommend reviewing your holdings and not being overweight in one particular sector. Don’t rush into buying stocks; look for a safer entry in 3-6 weeks to add to your investments.
I would love to hear from you. Please call me at 516-829-6444 or email at bgortler@signalert.com to share your thoughts or ask me any questions you might have.
If you like this article, then you will love this!
Click here for a free report: Top 10 investing Tips to More Wealth
*******Article in Systems and Forecasts November 10, 2016

Discover the right wealth building attitude…
Download a Free chapter of my book Journey To Wealth
Disclaimer: Although the information is made with a sincere effort for accuracy, it is not guaranteed that the information provided is a statement of fact. Nor can we guarantee the results of following any of the recommendations made herein. Readers are encouraged to meet with their own advisors to consider the suitability of investments for their own particular situations and for determination of their own risk levels. Past performance does not guarantee any future results.


