No drama has occurred in the stock market as October comes to a close. Investors continue rotating assets among different sectors as the major averages remain within a fairly tight trading range. For the short term the market is oversold and has favorable momentum patterns suggesting another attempt toward the highs is possible. Supporting the market is strength in the Technology (QQQ) sector, trading near their highs for the year. A big concern I have is the weakening momentum oscillators on the intermediate and long term charts on many stocks and several market indices.
As long as the support levels remain in-tact, the bulls remain in control. Each time the market trades near the top or bottom of their range, prices stall and move in the opposite direction. On 10/13/16, there was a small scare when the S&P 500 (SPY) slightly violated support at 212.00 intraday, tripping stops by investors. The S&P 500 (SPY) fell to a low of 211.21, however no heavy selling followed. On the same day the S&P broke below support, the Russell 2000 Index (IWM) held above its key support at 117.00. These are very important levels that need to hold.
Stock selection now is more important since market breadth has weakened considerably since the blast off from the February lows. There has been a lot of selling pressure in October by investors in health care (XLV), utilities (XLU) and real estate (IYR). Recently there were 104 stocks on the New York Stock Exchange Index making new 52 week highs, diverging from their peak reading earlier this year in July when there were 414 new highs. This is not a sign of a healthy broad market. The good news is 9/22/16, the New York Stock Exchange Cumulative Advance Decline Line made a new high. It’s very rare a market top occurs without at least another rally attempt toward new highs. As long as support levels hold, look for another attempt for the stock market to break out to the upside.
What Charts You Want To Watch Now:
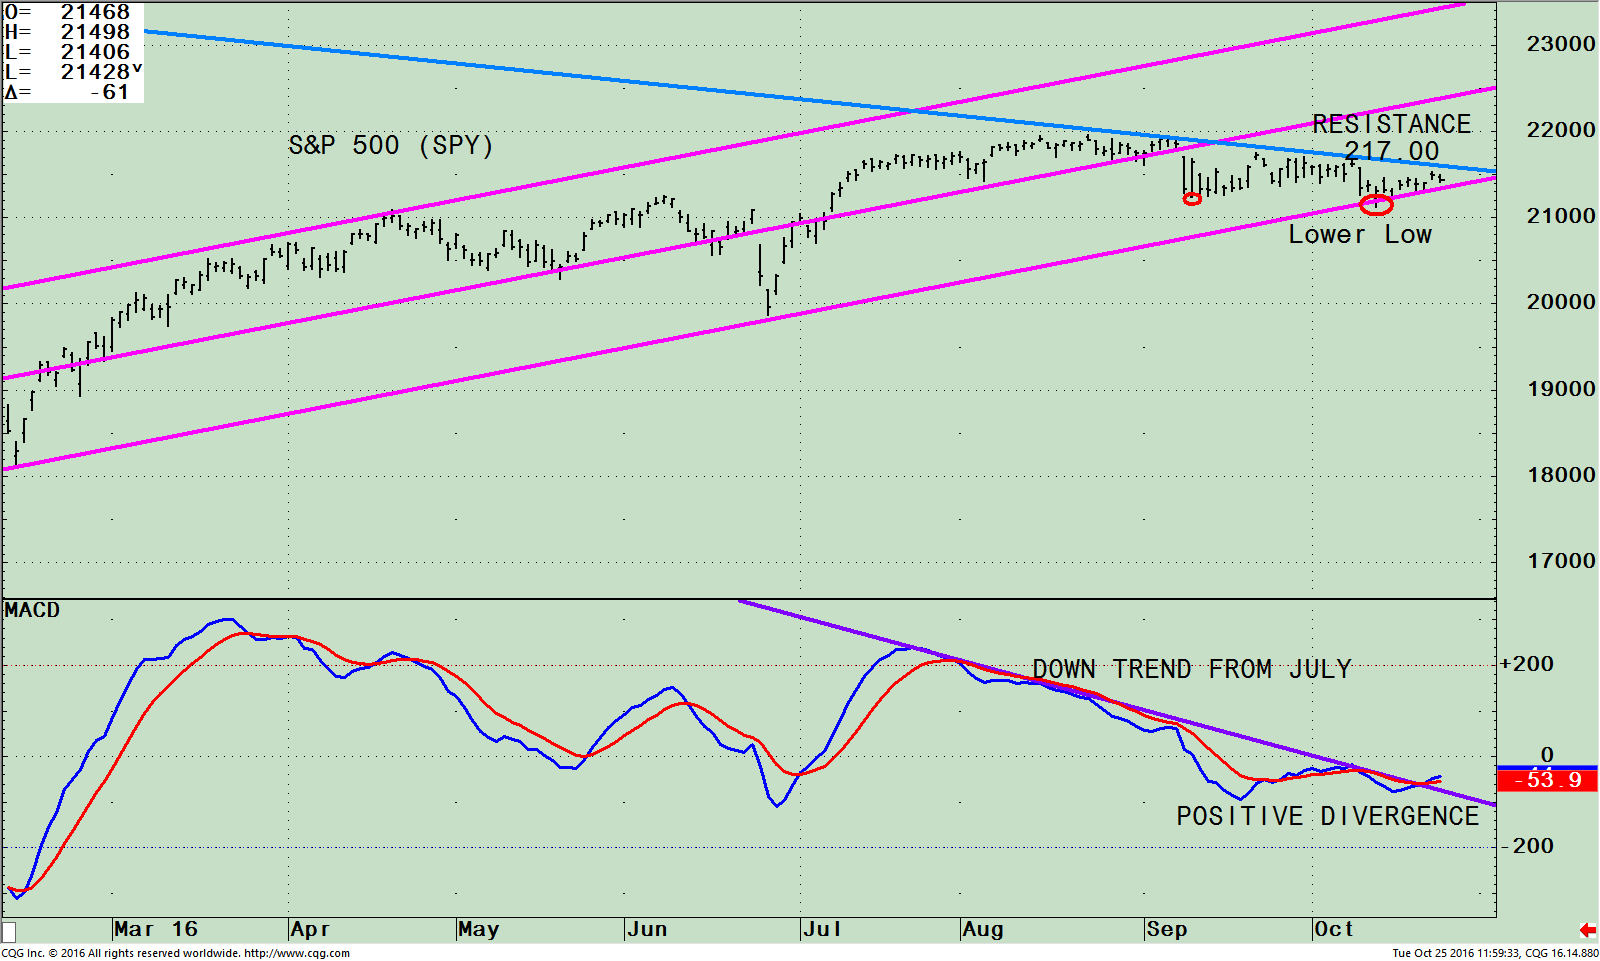
The SPDR S&P 500 (SPY) Daily With Channel (Top) and 12-26-9 Week MACD (Bottom)

The chart on the top is a daily SPDR S&P 500 (SPY) ETF that is comprised of 500 stocks of the largest companies in the U.S. The S&P 500 (SPY) is 1% from its lower channel and near its recent low. On 10/13/16, the S&P 500 (SPY) fell below support at 212.00, and made an intraday low of 211.21. Since then, there has been an unconvincing rally staying within a tight range. There is resistance above at 217.00. If the S&P 500 goes above 217.00 this will get the bulls excited. Under 212.00 the odds are likely the bears will rule and if the S&P 500 falls below 211.00 then expect heavy selling.
The bottom half of the chart shows MACD, a measure of momentum. One of my favorite technical patterns has formed a positive divergence suggesting the S&P 500 will go higher. A positive divergence is when you make a low in price (top chart) and the oscillator doesn’t make a lower low, instead the oscillator reading is higher showing positive momentum. This is exactly what is happening now in MACD. An added bonus, there is not only a positive divergence but there is also a slight penetration of the down trend. Until the uptrend is broken, give the benefit of the doubt to the bulls.
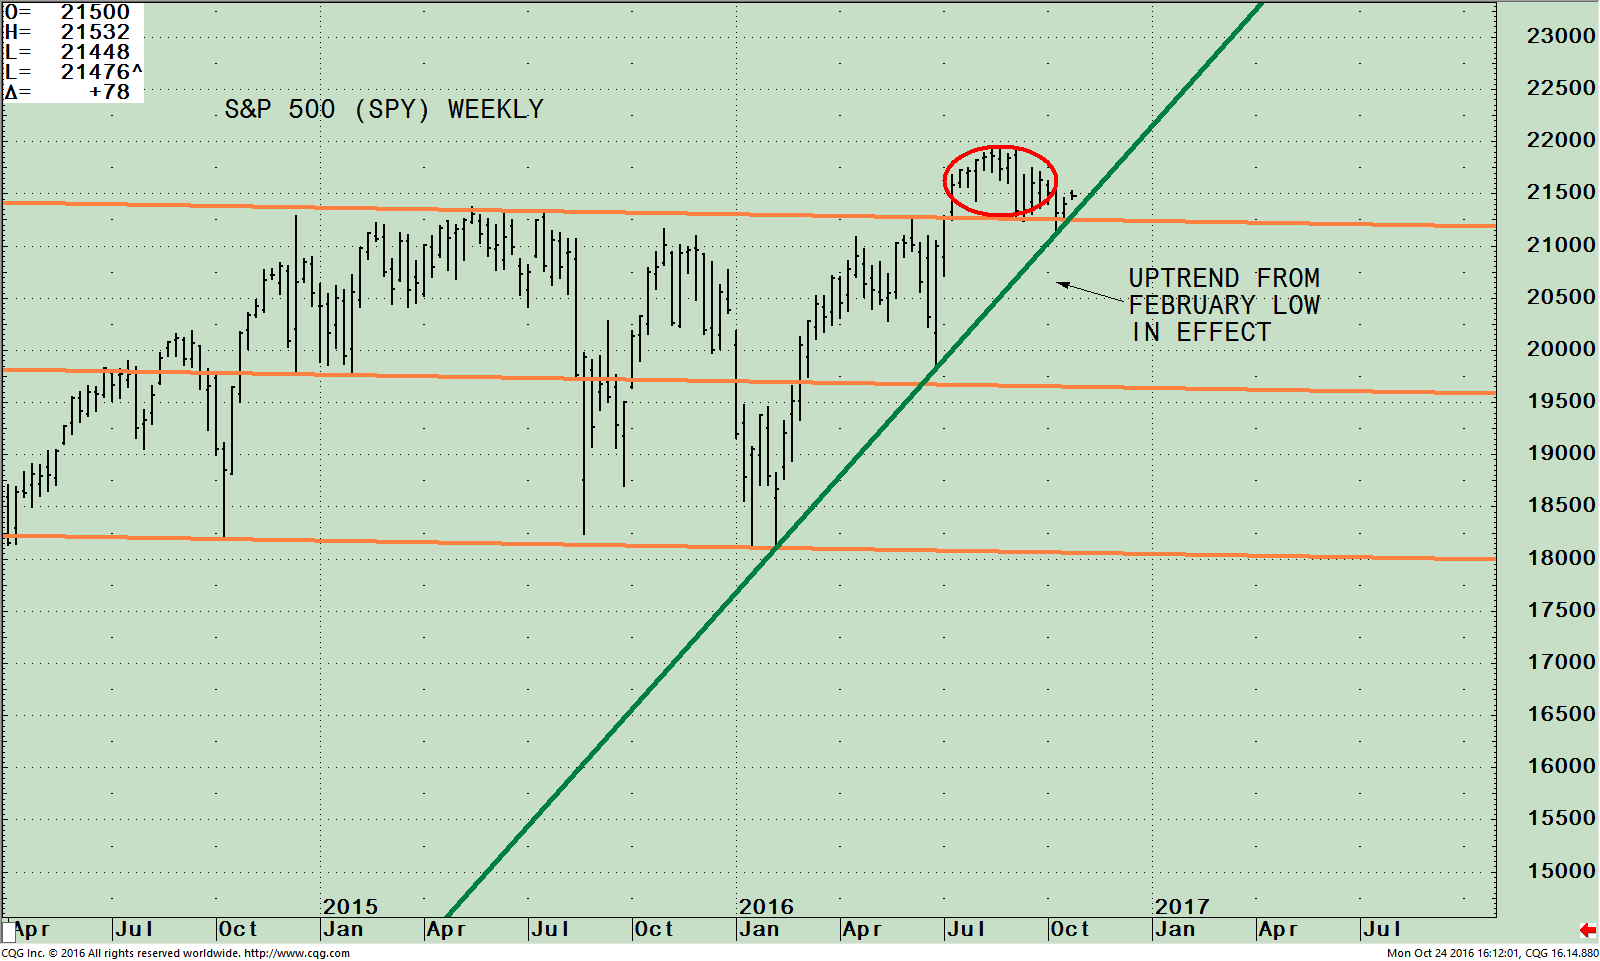
The SPDR S&P 500 (SPY) Weekly Price And Channel

The chart above shows that the S&P 500 (SPY) has broken out of its trading channel, penetrating resistance in July 2016 (red circle). The S&P 500 moved higher at first and then pulled back retracing its breakout and now is moving sideways. Notice on the recent sell off, the S&P 500 fell slightly below the channel making a low of 211.21 holding just the above up-trend line. For now, the intermediate trend is intact (the green line) and the trend is up. If violated it would not be a good sign for the final week of October or the start of November. Next support is the middle channel at 197.00, 9.35% lower from today’s close at 214.12.
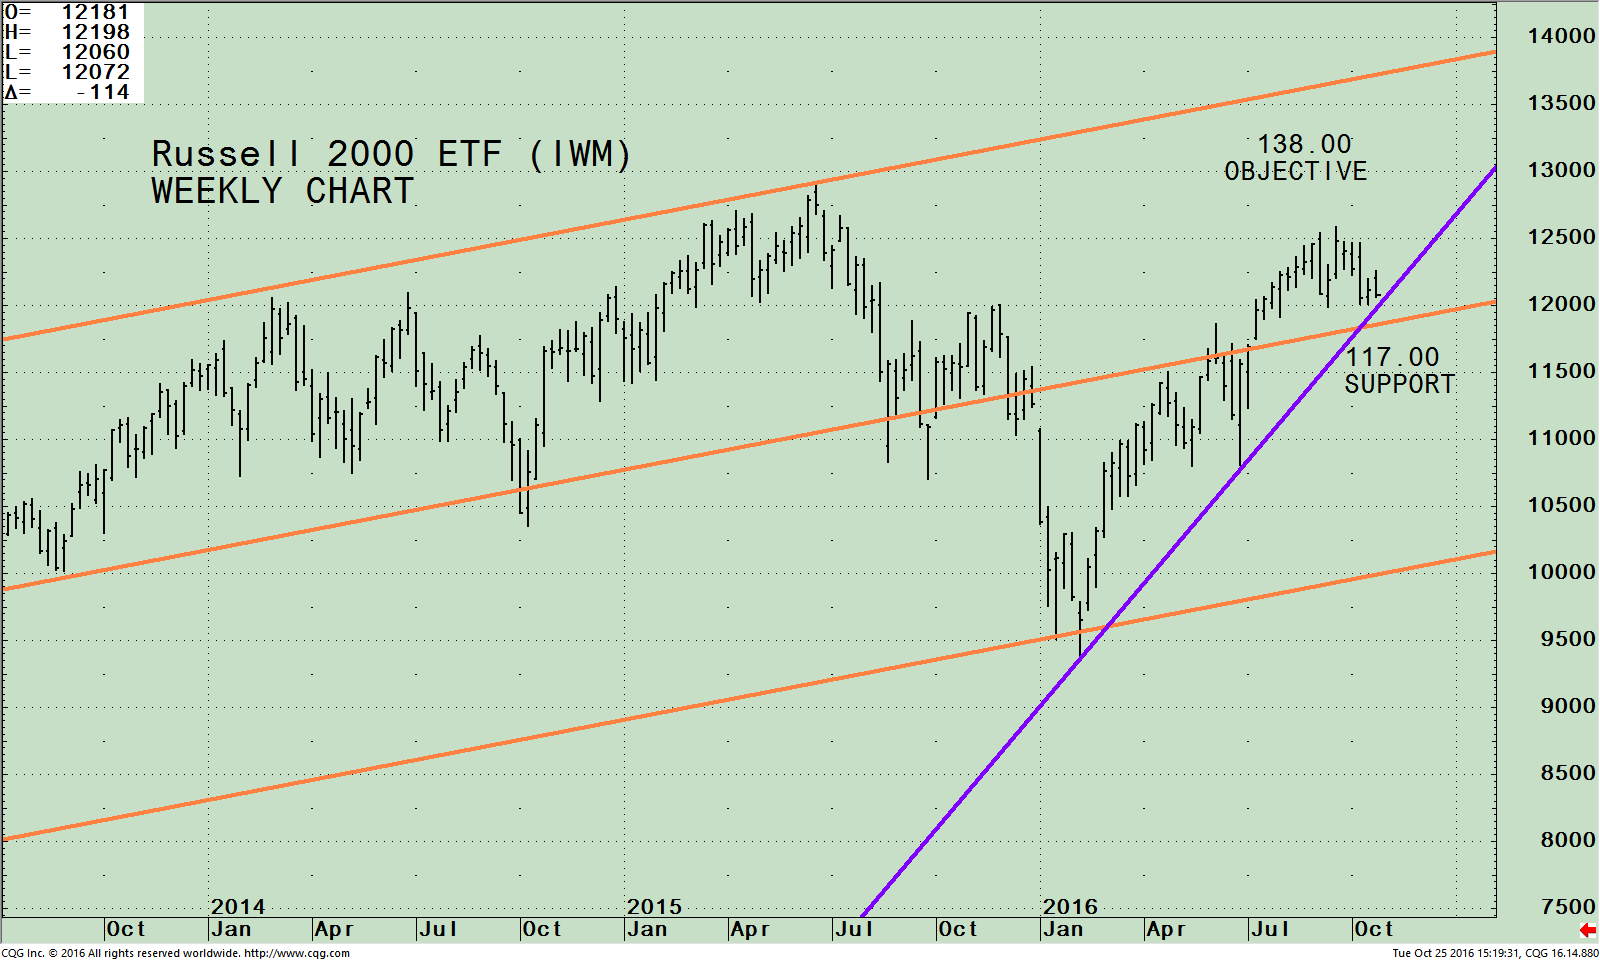
iShares Russell 2000 ETF (IWM) Weekly Price With Channel

The chart above shows the weekly iShares Russell 2000 Index ETF (IWM) which is made up of companies with a market capitalization of between $300 million and $2 billion. The Russell 2000 (IWM) rose sharply from its February bottom. The IWM failed on 9/19/16 at 125.88 to penetrate its high made on 06/22/15 at 129.10. The IWM turned down but is holding above the middle channel and above the uptrend line (blue line). Both the middle channel and the uptrend line are in the same area acting as support. As is the case with the S&P 500 (SPY) the intermediate trend remains up for the IWM. The upside channel objective is 138.00. As long as the IWM is above 117.00, higher prices are likely, however if the IWM falls below for two days on a closing basis, the intermediate trend would turn negative and the odds of a potential decline rise dramatically.
Summing Up:
The tug of war between the bulls and bears has not been decided. The S&P 500 (SPY) and the Russell 2000 (IWM) remain in their trading range. The market is short term oversold, and there is a positive divergence on the daily S&P 500 (SPY), bullish. As long as the support level remains in-tact, I recommend giving the benefit of the doubt to the bulls. If the S&P 500 (SPY) closes below 211.00 for two days expect the bears to come out of hiding and wider market intraday swings. Another point of reference is watching the Russell 2000, (IWM) to hold above its key support at 117.00. For now, the tug of war between the bulls and bears remain.
I would love to hear from you. Please call me at 516-829-6444 or email at bgortler@signalert.com sharing your thoughts, or ask me any questions you might have.
If you like this article, then you will love this!
Click here for a free report: Top 10 investing Tips to More Wealth
*******Article in Systems and Forecasts October 26, 2016

Discover the right wealth building attitude…
Download a Free chapter of my book Journey To Wealth
Disclaimer: Although the information is made with a sincere effort for accuracy, it is not guaranteed that the information provided is a statement of fact. Nor can we guarantee the results of following any of the recommendations made herein. Readers are encouraged to meet with their own advisors to consider the suitability of investments for their own particular situations and for determination of their own risk levels. Past performance does not guarantee any future results.


