Renewed talk of U.S. tax reform and the good start to earning seasons have pushed the Dow Jones Industrial Average to a new record high on October 24. However, the Nasdaq, S&P 500, and Russell 2000 were unable to do the same. The market has been in a steady uptrend since late August. As the rally continues higher, so does investor optimism. Short term price uptrends and support levels remain intact for the major averages.
Our equity timing model will shift from hold to bullish on November 1. Also unfavorable seasonality is out and favorable seasonality is in.
What to expect now? The bulls to remain in control:
- The daily tape action suggests there are no signs of a market top.
- Overseas markets are in uptrends supporting the U.S. Market.
- Although the Nasdaq is no longer leading in relative strength compared to the S&P 500, the top holdings Apple (APPL), Microsoft (MSFT), Amazon (AMZN), Alphabet Inc. Class A (GOOGL), and Facebook all remain above support. These stocks have quickly rebounded after a pullback.
- High Yield Bonds are at or near their highs.
- Volatility remains low.
- Market breadth indicators are positive. The advance/decline line has made new highs.
- The Russell 2000 (IWM) has been in a very narrow range since the highs made on October 4, not giving up much ground while digesting its gains after breaking out of its weekly channel.
Higher Intermediate Term Upside Objectives Remain For the S&P 500 (SPY)

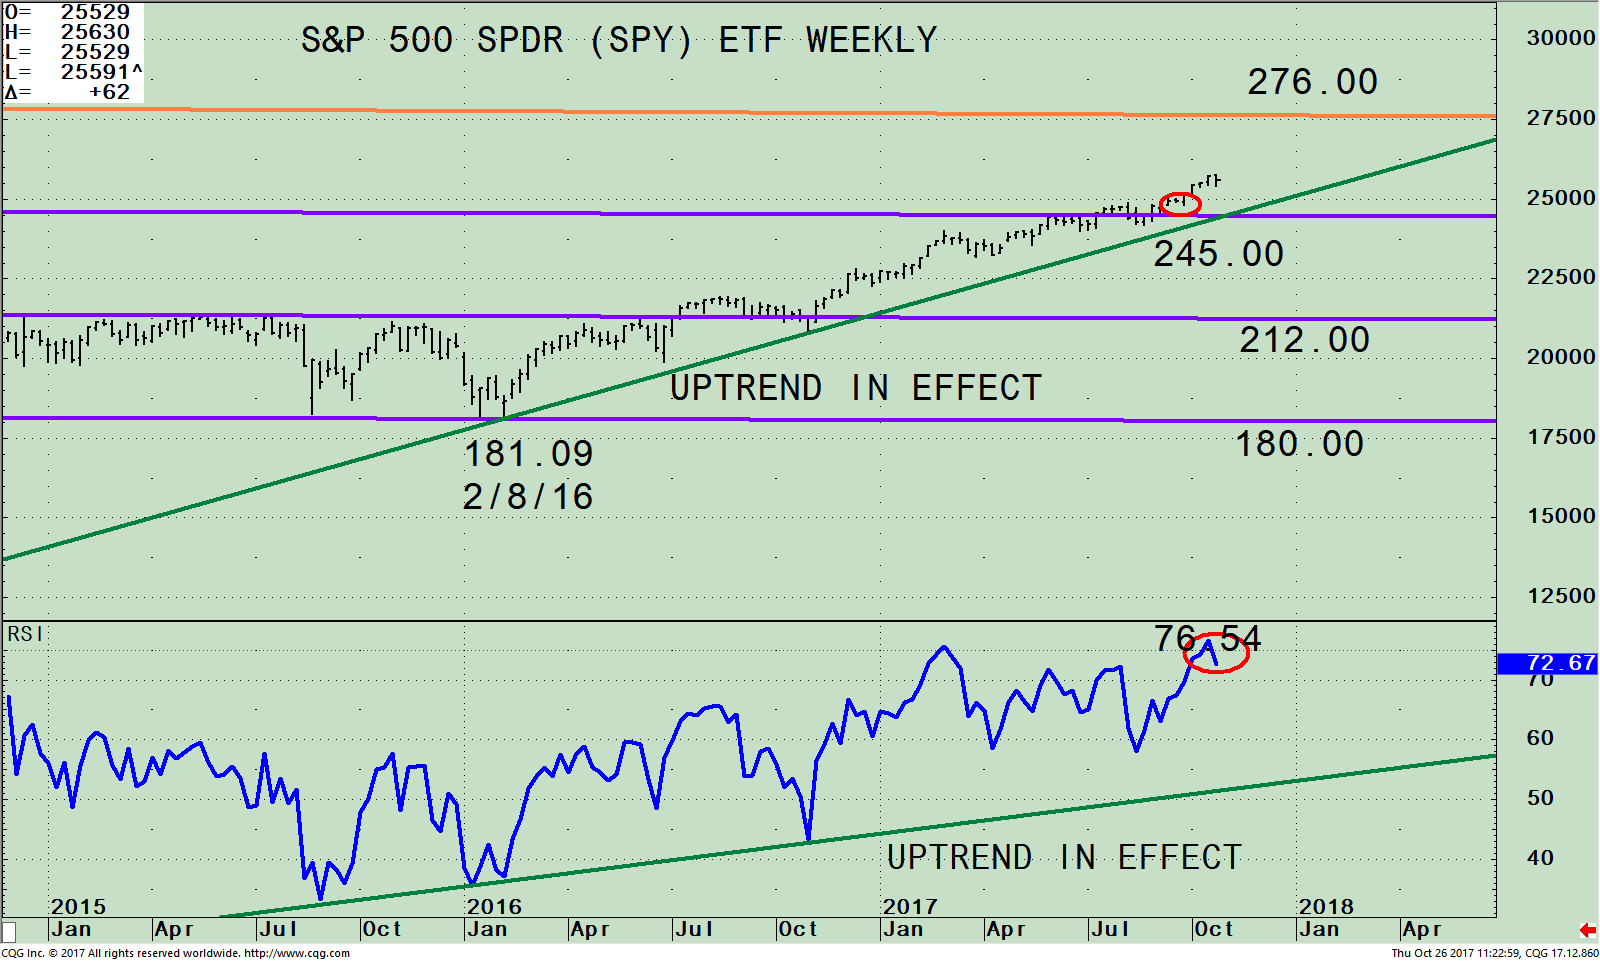
Figure: S&P 500 SPDR ETF Weekly Price Channel (SPY, top) and 12-26-9 MACD (bottom)
The chart above is the weekly SPDR S&P 500 (SPY) ETF that is comprised of 500 stocks of the largest companies in the U.S. When you invest in the S&P 500 (SPY), you will get a broad representation of the overall large-cap U.S. stock market.
As of 10/25/17 its top 5 holdings in the S&P 500 were Apple Inc. (AAPL) 3.67%, Microsoft Corporation (MSFT) 2.74%, Facebook (FB) 1.84%, Amazon (AMZN) 1.76%, and Johnson & Johnson (JNJ) 1.72% totaling 11.73%. The top part of the chart is the SPDR S&P 500 (SPY) ETF and its active weekly (intermediate) trading channel. The SPY continues its slow and steady rise this year. The SPY remains clearly in an uptrend that began in February 2016 (green line). Declines have been minor and brief. Until this trendline is broken, no serious threat of a major decline should occur.
The upside channel objective is 276.00 (orange line). In the unlikely event the SPY falls below 245.00, the area where the SPY broke out of its range, this would turn the intermediate trend negative and imply potential weakness towards the middle channel at 210.00
The bottom half of the chart shows the Relative Strength Index, a measure of momentum developed by Welles Wilder. RSI is based on the ratio of upward price changes to downward price changes. RSI peaked at 76.04 confirmed the SPY price high. RSI readings of 70 or higher show strength and are most times considered bullish, not a sign of a top. Generally, as long as RSI stays above 40, the trend is up. The bullish uptrend in RSI from 1/16/16 remains intact.
On the other hand, RSI has lost some momentum. It’s normal for momentum to weaken (red circle) after a large rally. Short-term weakness is perfectly normal after a large run-up in prices. We should expect to see either a minor pullback or sideways consolidation before another rally attempt can occur. If the SPY penetrates 258.00, just above the recent highs, the buyers will step in.
In Sum
As long as the S&P 500 (SPY) uptrend remains in effect, SPY should work its way higher toward the upper weekly channel at 276.00. If the downtrend is broken (green lines) on either price or RSI a warning sign would be given and caution would be recommended. With our trading model likely to change from hold to the most bullish condition on November 1, and November and December historically a very favorable time for investment gains in equities, I recommend buying dips in the S&P 500 (SPY) as long as the SPY remains above 245.00.
I would love to hear from you. Please call me at 516-829-6444 or email at bgortler@signalert.com to share your thoughts or ask me any questions you might have.
Sign up for a FREE 3 issue trial of Click Here: The Systems & Forecasts Newsletter
*******Article published by Bonnie Gortler in Systems and Forecasts October 26, 2017
Disclaimer: Although the information is made with a sincere effort for accuracy, it is not guaranteed that the information provided is a statement of fact. Nor can we guarantee the results of following any of the recommendations made herein. Readers are encouraged to meet with their own advisors to consider the suitability of investments for their own particular situations and for determination of their own risk levels. Past performance does not guarantee any future results.


