The Dow, S&P 500 and Nasdaq completed its best year since 2013. Many global markets broke out from long-term down-trends igniting interest among investors, achieving gains of over 20%. In addition, 2017 was one of the least volatile years I have witnessed in my over 35-year career. Technical indicators have confirmed the highs made in the major averages, and uptrends remain in effect.
The question remains can the rally continue in 2018?
The probabilities are high that further gains are likely. Our models indicate a positive market climate for the start of 2018. The bulls remain in control for now. However, optimism is at extreme levels, (a contrary indicator), investor’s cash is at levels that are the lowest since 2000, and interest rates are rising.
The Moment of Truth for the S&P 500 (SPY): Intermediate upside objectives are close to being met.
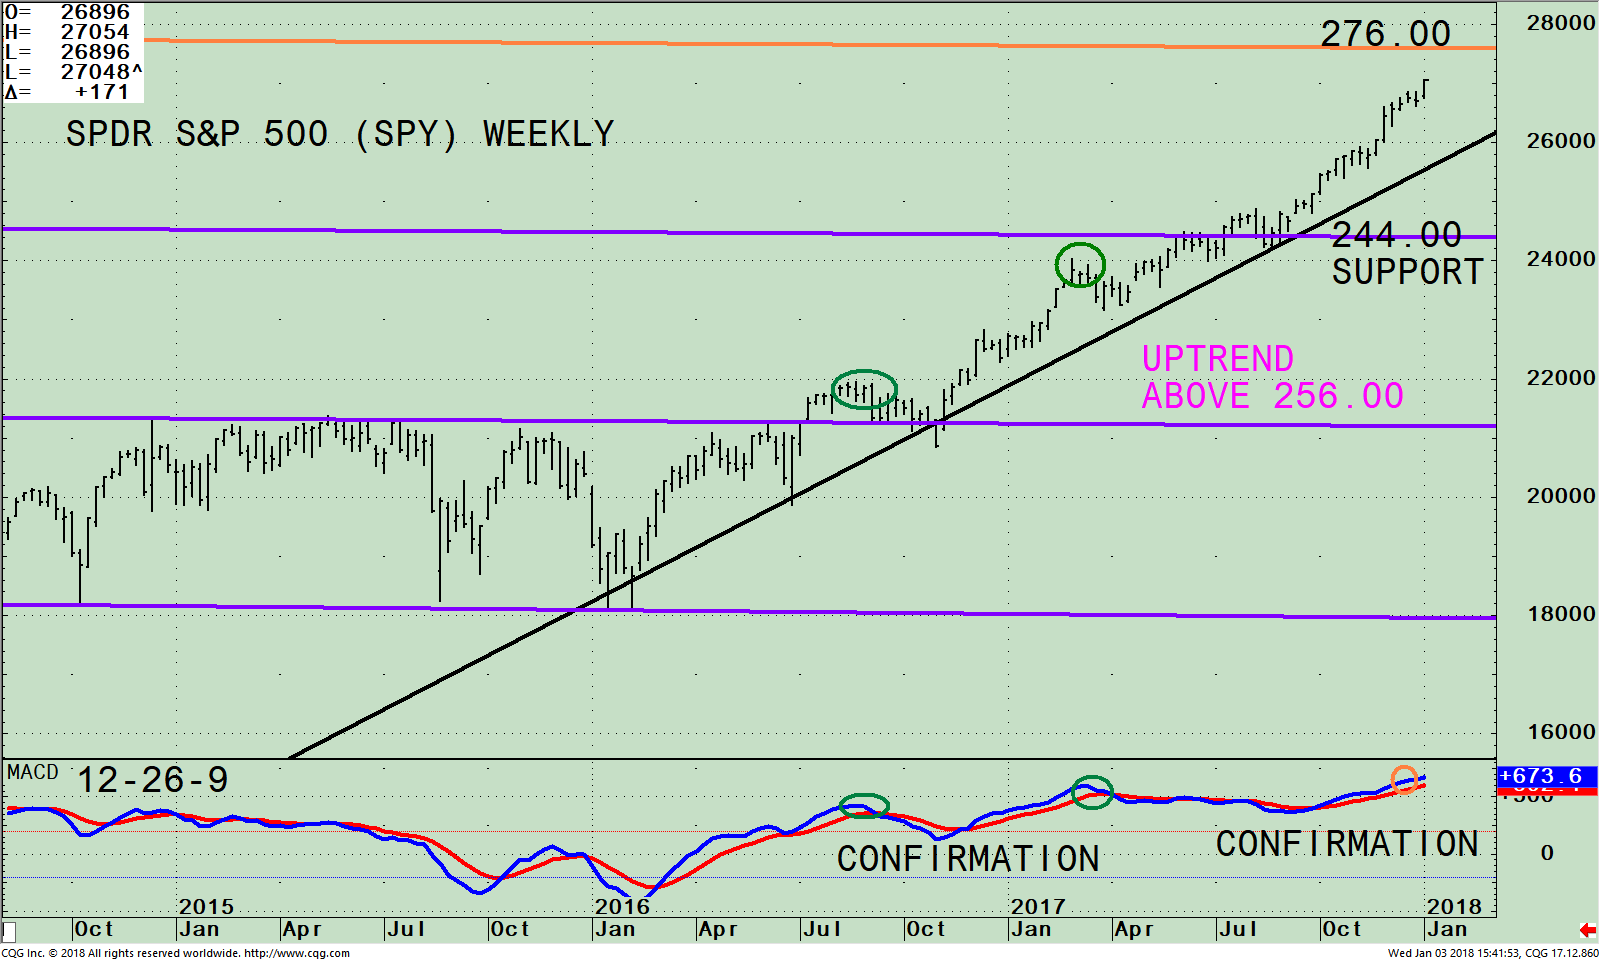
The SPDR S&P 500 (SPY) Weekly Price And Channel

The S&P 500 (SPY) is comprised of 500 stocks of the largest companies in the U.S. When you invest in the S&P 500 (SPY), you are getting a broad representation of large-cap U.S stocks with moderate risk.
The top portion of the chart is the weekly (intermediate) SPDR S&P 500 (SPY) ETF and its price channel (purple lines). The upside channel objective is 276.00 (orange line). The S&P 500 (SPY) has been in a weekly uptrend since February 2016 (black line), with only a minor penetration.
Until the upside trendline on the S&P 500 (SPY) is broken, where the SPY breaks below 256.00 on a weekly close, no serious threat of a major decline is likely.
The SPY declines in 2017 were less than 3%, much lower than normal. In 2018 look for declines to be larger as volatility picks up and investors decide to lock in some of their profits.
Notice how the SPY is very close to its upside objective. If penetrated it would be bullish and suggest the rally can go significantly higher. A turn down in the near term without reaching the channel objective at 276.00 would suggest the SPY is ready to pause and potentially pullback to support at 244.00.
The lower portion of the chart is the 12-26-9 MACD, a measure of momentum. MACD is rising and has confirmed the recent price high made by the S&P 500 (SPY), (orange circle), suggesting the final top has not been reached. MACD is showing strength instead of weakening momentum.
Summing Up:
Stocks continue their advance to start 2018 after completing its best year since 2013. There is no serious threat of a major decline unless the S&P 500 (SPY) intermediate uptrend is violated. Watch for a shift in trend if the SPY breaks below 256.00 on a weekly close. For now, continue to celebrate and enjoy the ride as the bulls remain in control and the bears remain in hibernation.
I would love to hear from you. Please call me at 516-829-6444 or email at bgortler@signalert.com to share your thoughts or ask me any questions you might have.
Sign up for a FREE 3 issue trial of Click Here:
The Systems & Forecasts Newsletter
*******Article published by Bonnie Gortler in Systems and Forecasts January 05, 2018
Disclaimer: Although the information is made with a sincere effort for accuracy, it is not guaranteed that the information provided is a statement of fact. Nor can we guarantee the results of following any of the recommendations made herein. Readers are encouraged to meet with their own advisors to consider the suitability of investments for their own particular situations and for determination of their own risk levels. Past performance does not guarantee any future results.


