Stock Market Rally Continues But Russell 2000 Chart Flashes Negative Warning
 February is off to a great start with the major U.S. market averages such as the S&P 500, Dow Industrials, Nasdaq Composite and Russell 2000 near or at highs for the year. Investors are acting more optimistic, with more buying than selling, causing prices to move higher as they are willing to take more risk. Even with talks of Greece exiting the Eurozone, along with potential higher US interest rates possibly in June, and intermediate technical momentum patterns weakening, the US market forges ahead.
A change in sector leadership away from defensive areas–healthcare, utilities, and consumer staples–occurred in the first half of the month as traders were willing to take on more risk. Those areas weakened more than the major averages. PowerShares QQQ has broken above key resistance trading over 105.00, as mentioned in the February 6th newsletter, now trading at 107.02 at the time of this writing. Apple, the largest holding in the Nasdaq 100 Index (tracked by QQQ) leads the way, now trading at 128.46 near more resistance at the 130 area. The S&P 500 also is showing how resilient it is, working its way higher with the technology sector and financial sector strong. Small caps have also been acting better, closing above
121.41 the high of 2014, now trading at 121.71.
What Are The Charts Saying Now?
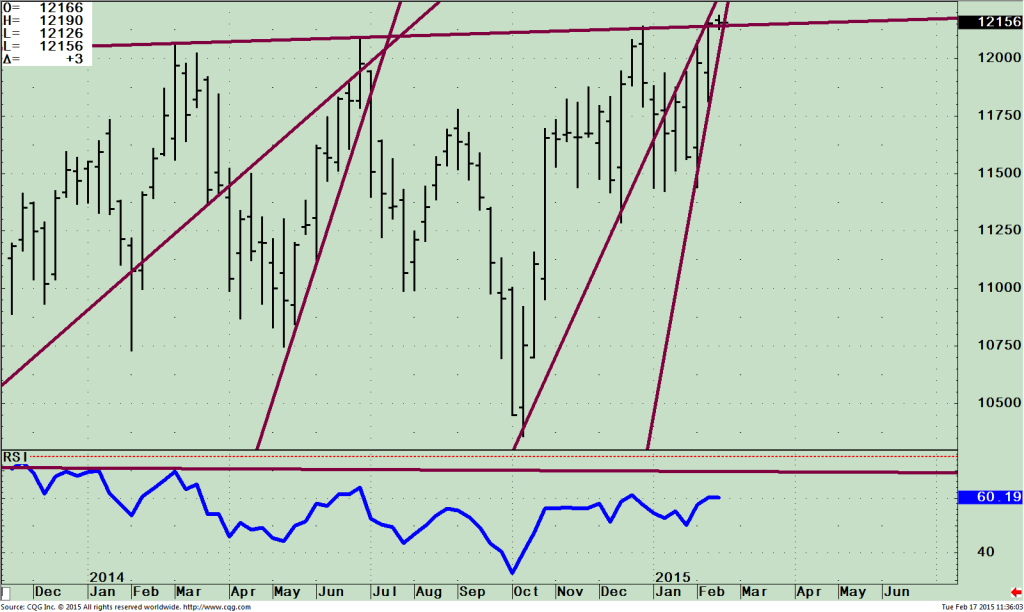
IWM Ishares Russell 2000 ETF Weekly Price (Top), and RSI 14 (Bottom)
 The top chart shows the weekly Hi-Low-Close starting in November 2014 of the Russell 2000 Index ETF (IWM). I found in my charting analysis that the more points touched on a line, the more significance it has. Notice the horizontal line that has been touched four times now, connecting February 2014, June 2014, December 2014, and January 2015.
All four times the rally stalled and prices turned down. The IWM is at a key resistance zone, trading at 121.60. Once again price might not be able to significantly penetrate this zone and rise much further from here. I believe that the IWM will stall in this key resistance zone and prices will move lower like it did in June of 2014.
The pattern has formed a clear bearish wedge. This is where trend lines converge creating an arrow shape. Notice the February – June time period on the chart is a very similar looking pattern to what we are seeing now. In June prices traded between two upward moving sloping lines and then price broke to the downside, falling 11.1% from the peak to its low.
The lines are steep; therefore they will be broken soon even if the market simply rises at a slower rate. However, I believe the break will be to the downside. If IWM does stall now, it could potentially fall quickly to 114.50, a likely area of retracement. The next lower downside objective would be 110.00, potentially a 9.5% decline.
The lower portion of the chart is the Relative Strength (RSI 14) indicator, a momentum indicator like MACD. 
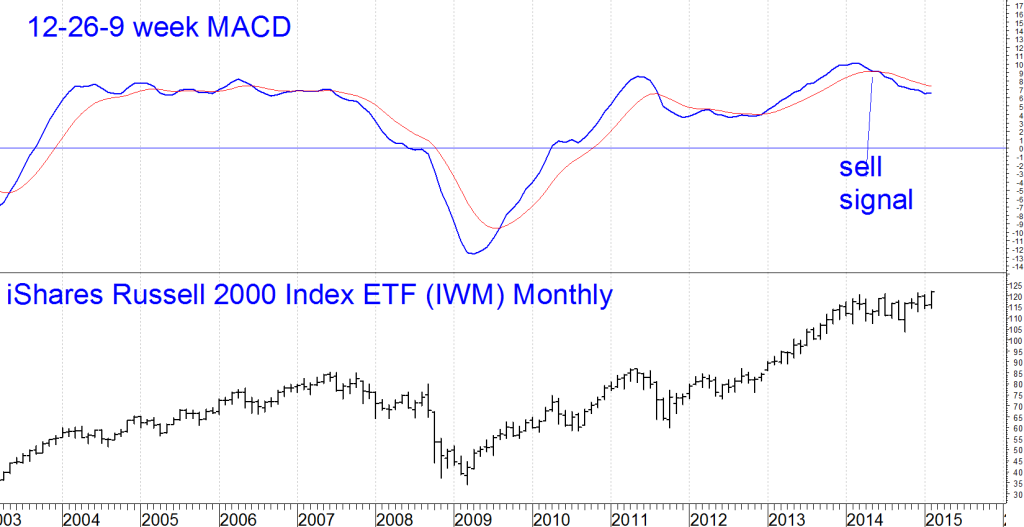
Notice how RSI has flattened and is no longer rising, not gaining very much upside momentum on this latest rally. A sign of strength would be if RSI could get to the 70 level, (RSI now at 60.18). 80 would be even better, but I’m not expecting this, since it happens infrequently. In 2014 there were no real upside surges of momentum that reached these levels. Each time the market paused and retraced its gains. This latest rally was no exception, no penetration of the trend line has occurred, suggesting no new upside thrust is expected. On a side note, MACD has already generated a sell signal on the monthly chart clearly showing weakening momentum for the longer term. (See chart at right.)
Just To Sum Up
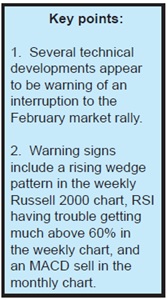
Even though major market averages are trading at or near their highs, intermediate and long term momentum patterns are not confirming the highs, warning of a potential decline ahead. Another warning signal has flashed, a clear rising wedge which is bearish on the weekly Russell 2000 (IWM), joining the Nasdaq 100 (QQQ) in displaying weakening momentum patterns. Although no real decline has started yet with most investors buying stocks and pushing prices higher, investors could quickly change their minds. Buying could turn into selling, and investors could opt for greater safety by reducing their equity holdings.
For now, the market still has a bullish tone which most likely will continue until an unforeseen event triggers more selling and investors start selling and taking profits. Don’t be the one getting caught up in the euphoria of the market making new highs and taking more risk than what would allow you to sleep peacefully at night. Review your investment holdings to make sure you are not overweight in small caps. My suggestion is to take some profits! New investment purchases are not advised at present price levels, a safer entry is more likely after retracements to 114.50 followed by 110.00.
I invite you to share your insights by calling me at 1-844-829-6229 or Email me at bgortler@signalert.com with your questions or comments.


