S&P 500 (SPY) Trend Could Shift from Positive to Negative Quickly
August is typically a poor month for the US equity markets except last year, when it gained over 5%. Most of the major U.S. stock indexes have held above their lows for 2015.
The S&P 500 Index continues to trade towards the high end in a very tight 6 month range. August is now half over, and there has been no major move to the up or downside (as of 08/19). The S&P 500 so far is giving the appearance that it’s no closer to breaking out to the upside or falling below the lower part of the range, than before I left for vacation in the middle of July.
Many major averages are trading within tight ranges. Short term MACD’s are no longer overbought, but are moving into oversold positions from which a potential short term rally attempt could begin.
Other sectors such as healthcare, biotech, small caps and semiconductors are having wider daily ranges than the S&P 500, and are areas with potentially increased risk.
Favorable momentum patterns that were seen in longer term charts are now showing weakening momentum, warning more selling could take place.
Odds would increase of a rally taking place, along with less risk, if a bullish thrust would occur, generating a buy signal from our trading models. So far this has not been the case. With present tape action, this doesn’t appear likely now. Time will tell.
Helpful Insights/Observations You Want To Consider
The Financial Sector (XLF) remains favorable, with the weekly uptrend in effect since May of 2012. The financial sector has been holding up well with the anticipation of the Fed raising short-term interest rates, which could be seen as positive for bank profits. Currently a break below 24.00 would break the uptrend.
Energy, one of the weakest areas of the stock market, has been under heavy selling pressure this year. At the end of July energy was oversold. It looked like a bullish base was forming, but the rally failed quickly generating more selling pressure. Still risky!
The trailing 52-week new lows on the New Stock Exchange are over 150 and the trailing new 52 week new highs are under 100. This is clearly showing that the market is very selective. Notice on some up days, new lows are increasing, not decreasing. This is a sign that the market is not healthy. The overall market breath is very narrow led by fewer and fewer stocks, making stock selection important. RISK is higher now than earlier in the year!
Semiconductors, (SMH) strong earlier in the year is now one of the weakest sectors, not a healthy sign for the overall market. Price broke intraday below 50.00 under recent support but has had no follow through to the downside.
The Dow Jones Industrial Average has generated a death cross sell signal, falling below its 50day simple moving average, (traders use this average as a quick guide to measure the health of the short term trend) and crossing below the 200-day moving average (traders use this average to measure the health of the longer-term trend). This signal last occurred December of 2011, a major bottom, not a top. Sometimes when a death cross happens, the signal occurs near a bottom and turns up instead of falling further.
The Biotech/Health Care sector has lost some of its luster since the middle of July, now looking more vulnerable than it has all year. This is not a safe time to enter into new positions.
Volume patterns on the New York Stock Exchange and the Nasdaq are disturbing. (See page 3.) They are not in favorable position, needing more of a sell-off to be in an oversold position that could support a meaningful rally.
Emerging markets and commodities remain under pressure, and in a clear downtrend. Bottom fishing Volatility (VIX, a measure of fear) remains low due to the sideways action in the market, however now has started to rise again. Wider trading swings are very possible intraday.
Utilities have been strong over the past few weeks, with long term rates declining, and investors moving their money into more defensive sectors for safety. On a short term basis Utilities are overbought: in position for a potential pullback from here.
What Do The Charts Say?
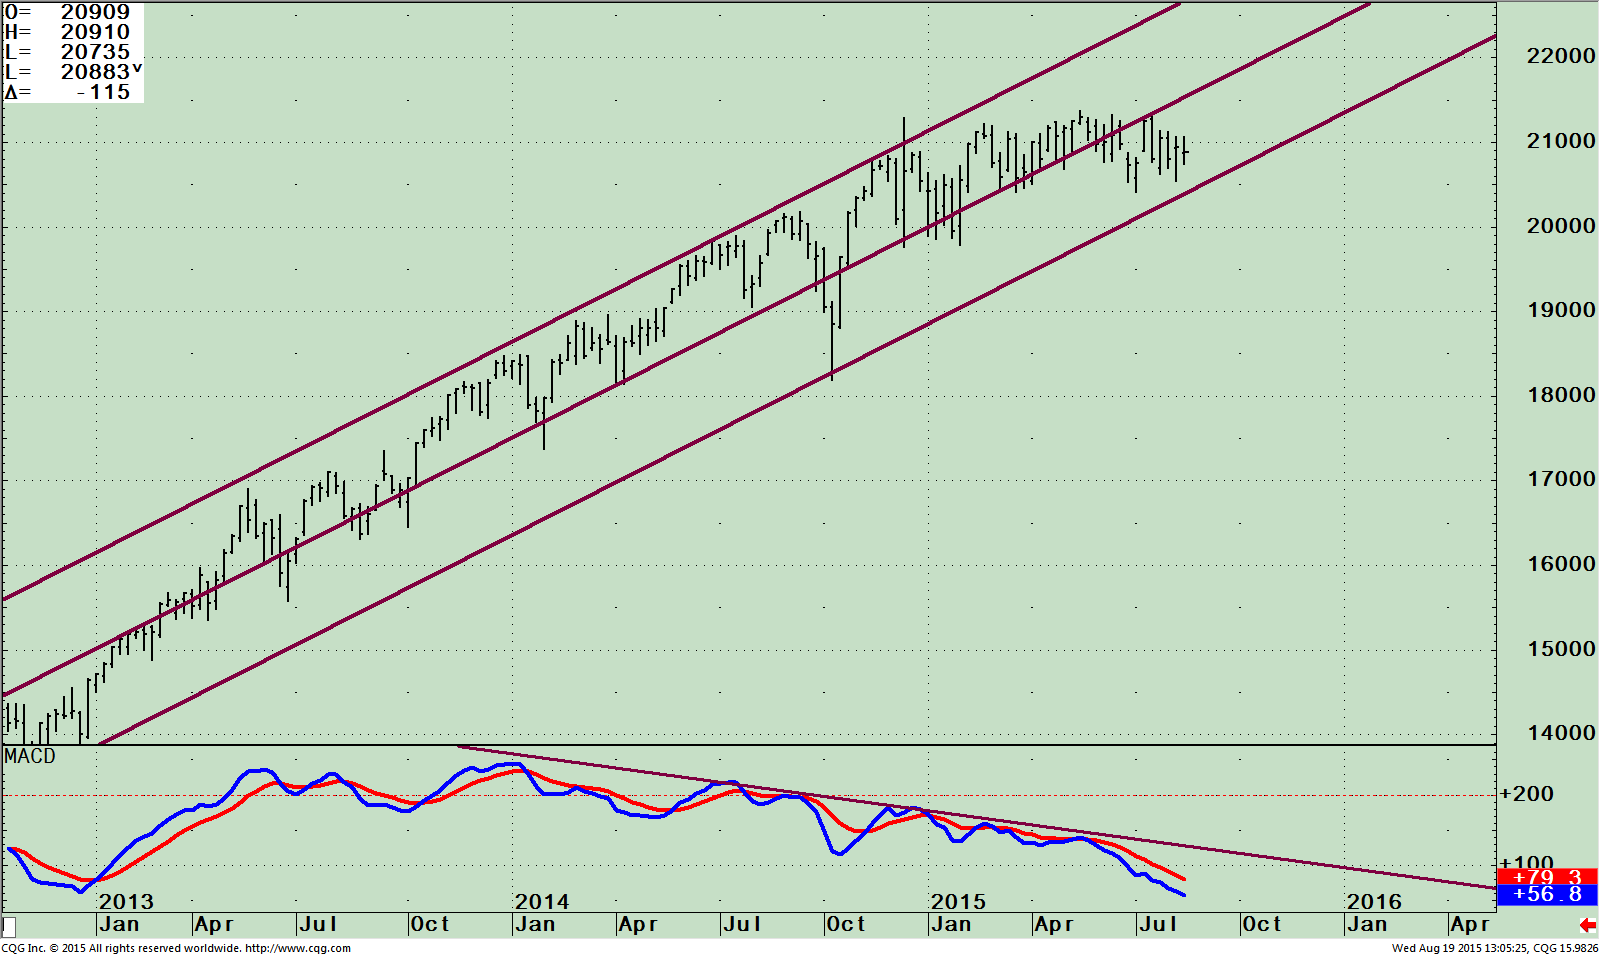
SPDR S&P 500 (SPY) Weekly ETF (Top), and MACD (Bottom)

The top portion of the chart shows that the S&P 500 is trading in a sideways trend near the high end in a very tight 6 month range. There hasn’t been a 5 percent pullback in the S&P 500 since December 2014. Note that the uptrend remains intact from January 2013. If the decline continues, which I believe it will, the uptrend would be broken. A shift from a positive trend to negative will increase the risk in the near term. This would most likely shift short term trader’s mindset to selling the rallies instead of buying the dips accelerating the decline further. Key support is 207 followed by 204. A break below 204.00 could be significant giving a downside objective to 182, near the Oct 2014 lows. (continued on page 8) The lower portion of the chart is the technical indicator MACD, clearly showing the continued declining momentum as price has moved sideways. MACD is falling, also above 0, therefore is not yet in an oversold condition where significant rallies do develop. There is no positive divergence forming at this time where price is making a low and MACD makes a high.
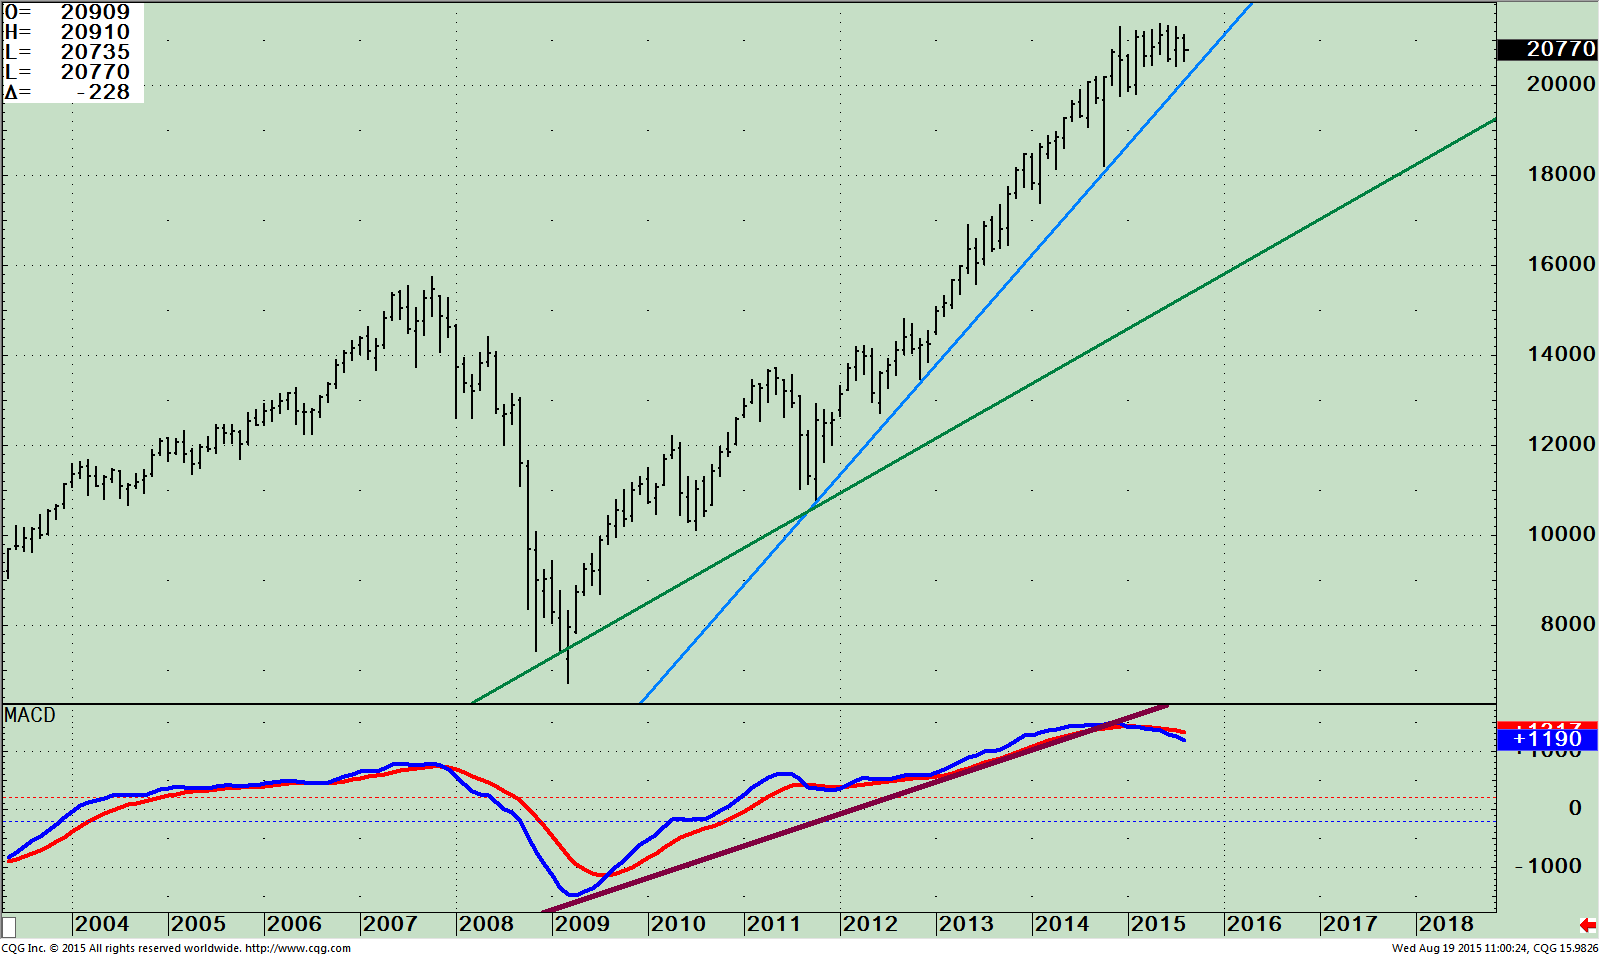
SPDR S&P 500 ETF (SPY) Monthly Price (Top), and MACD (Bottom)

The top part of the chart above is the S&P 500 (SPY) in a monthly uptrend since 2011 (blue line) with an even longer term uptrend from 2009. The lower chart shows MACD falling, clearly losing momentum and rolling over, suggesting risk is increasing and a decline is likely. Price action since Dec 2014 this year has been very contained, with the S&P 500 never up more than 4% from high to low, but this could soon change. If the S&P 500 (SPY) falls below 204.00 and closes below 200.00 both the weekly and monthly trend would be negative increasing the odds that the next move will be lower.
Just to Sum Up
More whipsawing action could take place until a final break out or break down occurs from the present 6 month trading range. Intermediate and long term price charts remain in uptrends but MACD very clearly is giving warning signals that a new decline is on the horizon. The S&P 500 is on the verge of shifting from a bullish to bearish phase for the intermediate and long term trend. Risk is increasing. Bearish warning signs from MACD are clear but price hasn’t confirmed the trend change. If the S&P 500 (SPY) falls below 204.00 this would break an important uptrend. If you still don’t believe the move is for real, then look for a close below 200.00 for confirmation that a more serious decline has begun, which could bring the S&P 500 (SPY) to 182, near the October 2014 lows.
I would love to hear from you! Any thoughts, questions comments, feedback; please call me
at 1-844-829-6229 or email at bgortler@signalert.com.
*******Article in Systems and Forecasts August 20, 2015
Grab Your Free Trial of the Systems and Forecasts newsletter where I am the Guest Editor
Click Here http://bit.ly/1fM79hp
This is a hypothetical result and is not meant to represent the actual performance of any particular investment. Future results cannot be guaranteed.
Although the information is made with a sincere effort for accuracy, it is not guaranteed either in any form that the above information is a statement of fact, of opinion, or the result of following any of the recommendations made herein. Readers are encouraged to meet with their own advisors to consider the suitability of investments discussed above for their own particular situations and for determination of their own risk levels.


