Small Caps Gaining Momentum: Enjoy The Ride
 Most stocks have continued to advance in April, another profitable month for investors. On down days profit taking has been contained as the bulls remain in control. Investors appear fearless moving into higher risk sectors and away from defensive sectors. An important question remains will the major averages break out to the upside, or is it best to sell and go away in May?
Time will tell if the market continues to rise without a pullback, leaving some investors missing out on further profits. Our models remaining favorable,with above-average profit potential with risk well below average. I continue to give the benefit of the doubt to the bulls. The easy money from the February lows appears over. Stock selection regarding what sector to invest in will be important as we move further on in the year. Normally defensive sectors flourish as investors want quieter sectors as the calendar moves into the more unfavorable months of the year, May through October. Defensivesectors such as utilities (XLU) and Consumer Staples (XLP) have lost some of their luster. Investors have beenmoving money out of these defensive areas in April. Keep an eye out if this recent trend continues.
The technology sector (QQQ and XLK) has not been a strong. Poor earnings from Microsoft (MSFT) and AlphabetInc. Class A (GOOGL) didn’t help this area. In addition, Apple disappointed investors and fell hard as well.
Technology was losing momentum fast compared to the S&P 500 (SPY) even before all of these earnings reports.
In the long run this is not a positive development and bears watching.
Listen here to the audio version of the article “Small Caps Gaining Momentum: Enjoy The Ride”
These are some of my favorite sectors giving a sign of a healthy market going forward. The
financial sector (XLF) has penetrated its first level of resistance at 23.00 as mentioned in the 03/13/16 newsletter, 24.50 is next target. In addition Regional Banks (KRE) has joined in on the advance, a very strong performer in 2015. Also market breadth remains strong; more stocks are participating in the rally, helping the Russell 2000 Small Cap Index (IWM) and the Mid Cap 400 (MDY) sectors of the market. Review the tape action clues to monitor that I discussed in the 04/14/16 newsletter for more of what it is needed for further gains ahead. The
odds favor higher prices ahead.
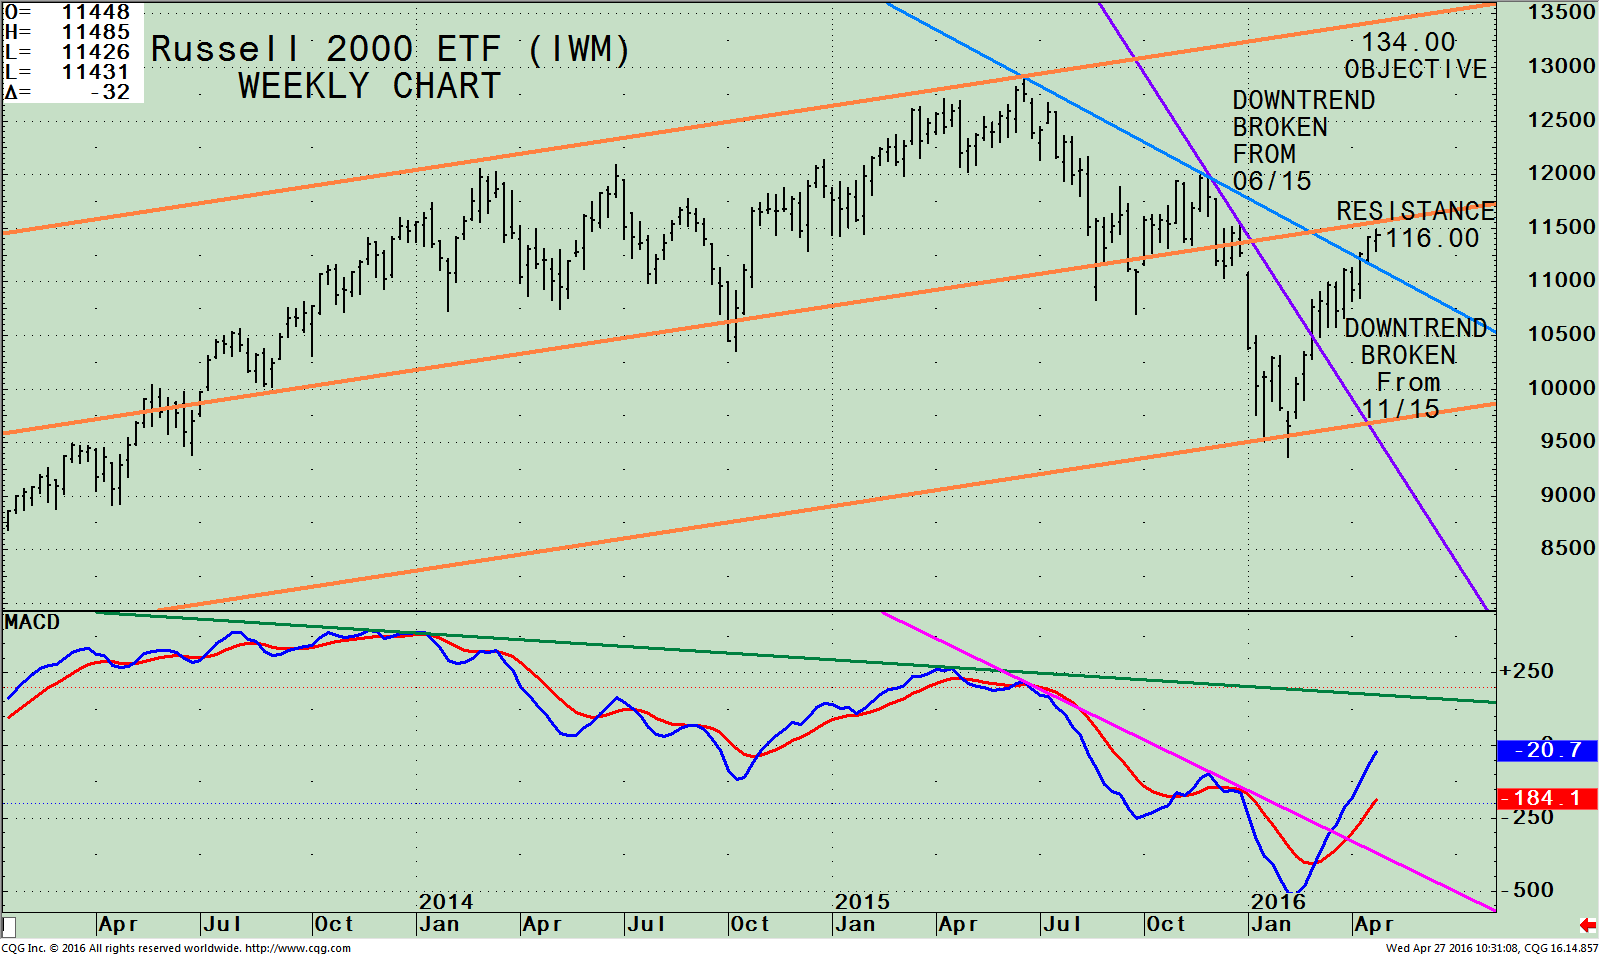
What Are the Charts Saying?–iShares Russell 2000 ETF (IWM) Weekly Price (Top), and 12-26 Week
MACD (Bottom)

The top portion of the chart shows the weekly iShares Russell 2000 ETF (IWM) which is made up of companies with a market capitalization of between $300 million and $2 billion. The Russell 2000 (IWM) peaked on 06/22/15 at 129.10 and has been out of favor with investors. In November 2015, normally a seasonally favorable period, the IWM tried to rally but failed. Now a new development has taken place, IWM is showing strength.
Notice the two key weekly significant downtrends that have been broken from June 2015 (blue line) and another from November 2015 (purple line) on this latest rally from the February low. This is bullish.
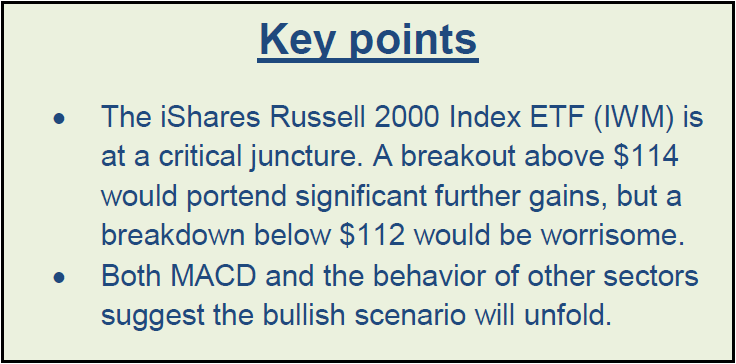
IWM closed at 114.63 on 04/26/16 clearing its 50 week moving average (line not shown). Resistance is just above at 116.00. If IWM can get through resistance, a move toward the upper channel objective at 134.00 is possible. If IWM pauses, on the other hand, then support is at 112.00. A break below 112 would negate my short term bullish outlook and cause me to reevaluate.
The lower portion of the chart is the technical indicator MACD, (a momentum indicator). MACD has generated a buy from an oversold condition and is rising rapidly breaking the short term trend line (pink line). Momentum has been in a long term down trend since December 2013 (green line). If IWM keeps moving higher this downward trend in momentum will change and turn favorable. The best is yet to come!
Summing Up:
Our models remain on a buy and in the most bullish condition. There is a lot of disbelief in the rally which is bullish. Tape action has been positive with market breadth strong, especially in the small and midcap sectors.
Financials have picked up their performance as well, all signs of a healthy market. Defensive areas such as XLU and XLP have been losing momentum. Technology was not acting very well, losing impetus before Apple’s disappointing earnings announcement. This needs to be monitored to see if it is temporary or a warning sign for the future. Sector selection will be important. I am recommending watching the Russell 2000 (IWM) to see if it can break through resistance at 116.00. If so, 134.00 is possible. A break below support at 112.00 would negate
my short term bullish outlook and cause me to reevaluate. The stock market is moving into an unfavorable seasonal period over the next few months. Review your investment portfolio, enjoy the ride now, however be ready with your exit strategy in case market weakness begins and the bears come out of hiding.
I would love to hear from you. Please feel free to share your thoughts, comments or ask any question you might have.
Please call me at 1-516-829-6444 or email at bgortler@signalert.com.
*******Article in Systems and Forecasts April 28, 2016

Discover the right wealth building attitude…
Download a
Free chapter
of my book
Journey To Wealth
Disclaimer: This is a hypothetical result and is not meant to represent the actual performance of any particular investment. Future results cannot be guaranteed. Although the information is made with a sincere effort for accuracy, it is not guaranteed either in any form that the above information is a statement of fact, of opinion, or the result of following any of the recommendations made herein. Readers are encouraged to meet with their own advisors to consider the suitability of investments discussed above for their own particular situations and for determination of their own risk levels.


