The stock market has quietly moved higher the past few weeks, not in an explosive way where prices move up quickly generating lots of excitement from investors and traders, but instead slow and steady. Some indices have penetrated resistance and others are near the top of their range. Summer months are upon us, historically an unfavorably season period, also a time when many investors go away, (like me). Our models are in a bullish zone, now in the most favorable condition, where risk is well below average as the market continues to climb the wall of worry. It would help to convince traders to reduce their cash holding that is not invested and is on the sidelines, if the S&P 500 could convincingly get through resistance above. Even better, would be if a pickup in volume on rising days tripping the traders stops. Nobody wants to miss a good party.
Investors have shown interest in more risky sectors such as oil, commodities, emerging markets, small and mid-cap sectors, and a sign of a healthy market. The midcap sector has been a leader of the advance this year, a bullish sign for the overall market. The tape action continues to be favorable suggesting further upside potential is likely. Market breadth continues to be very positive, now with an increase in stocks making new 52 week highs and very few stocks making new 52-week lows. This phenomena historically has been bullish, not the sign of a market top.
Charts to Monitor:
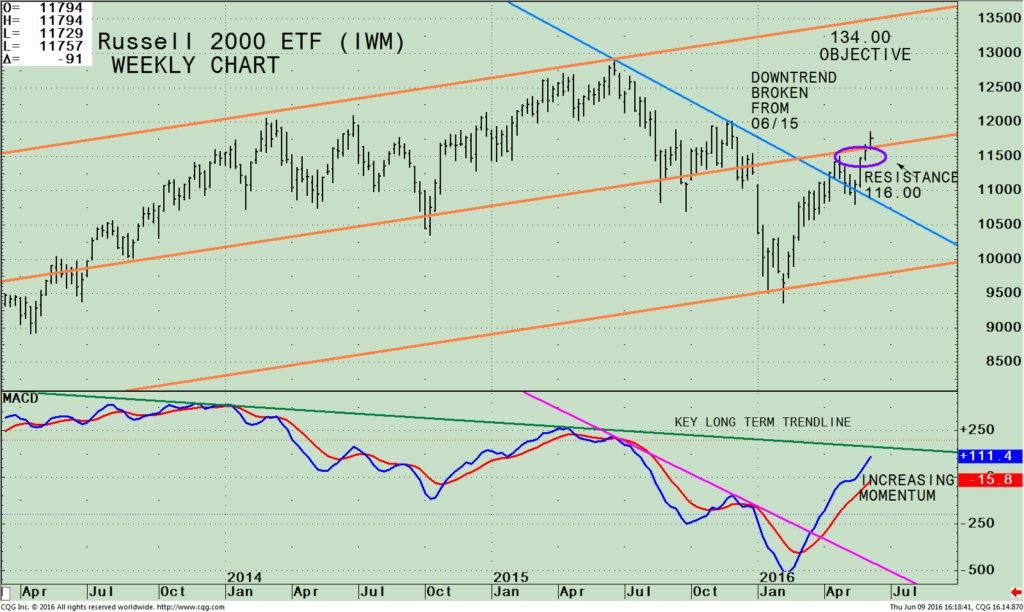
iShares Russell 2000 ETF (IWM) Weekly Price (Top), and 12-26-9 Week MACD (Bottom)

The top portion of the chart shows the weekly iShares Russell 2000 ETF (IWM) which is made up of companies with a market capitalization of between $300 million and $2 billion. The Russell 2000 (IWM) peaked on 06/22/15 at 129.10 and at that time out of favor with investors.
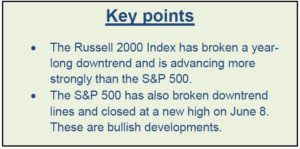
Good news for the stock market: The Russell 2000 (IWM) has come to life!
The IWM has broken through the downtrend from June 2015 (blue line) and made it through resistance at 116.00.
This is very significant! Small caps have joined the midcaps, now stronger than the S&P 500. This development is a sign of a healthy stock market. I am looking for the IWM to move towards their old highs, coinciding with the upper channel objective at 134.00. A break below 105 would negate my short term bullish outlook and cause me to reevaluate.
The lower portion of the chart is the technical indicator MACD, (a momentum indicator). MACD is positive and is rising rapidly breaking the short term trend line (pink line). Momentum has been in a long term down trend since December 2013 (green line). A few weeks of strength and the downward trend in momentum will be broken to the upside which in turn will make it easier to make money in small cap stocks.
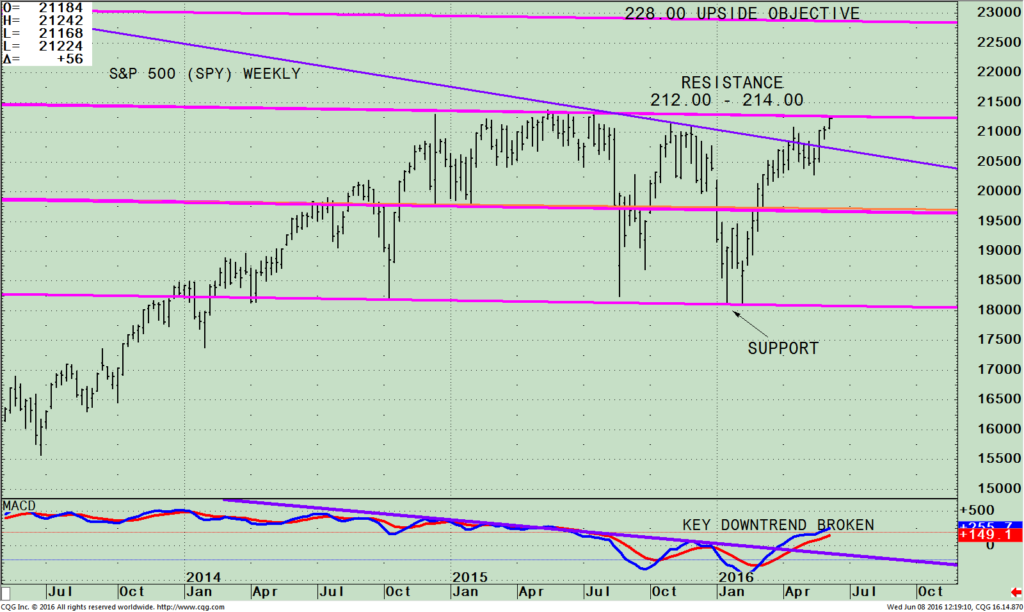
The SPDR S&P 500 (SPY) Weekly With Channel (Top) and 12-26-9 Week MACD (Bottom)
Revisiting April 14, 2016 Chart in S&P 500 newsletter:

The top chart is the weekly SPDR S&P 500 (SPY) ETF that is comprised of 500 stocks of the largest companies in the U.S. The S&P has been in a range between 180 and 213.78 staying within the trading channel (pink lines). If the S&P can close above 214.00 for two days, then 228.00, a 6.5% rise is the upside objective.
The S&P 500 (SPY) made a new high for 2016, and is now at the top of its range, the down trendline from July 2015 has been broken, a positive sign. Once again the S&P 500 is close to having an upside breakout. I love this type of basing formation because when it finally does move outside the base, it can be explosive!
The bottom half of the chart shows MACD, a measure of momentum, on a buy. The downtrend from May 2015 (purple line) has been violated, a bullish sign suggesting the SPY is on its way to get through overhead resistance sooner rather than later. Traders have been moving their money into small and midcaps, a potential reason why the S&P is lagging. The S&P 500 (SPY) does still gives you a good representation of the overall market with less risk.
Summing Up:
Favorable tape action with small and mid-caps leading the market higher and strong market breadth are all are very encouraging signs that the major market averages will move higher and any resistance above will be broken to the upside. Market breadth continues to be very positive, not signaling signs of a market top.
The iShares Russell 2000 Index ETF (IWM) has come to life, now stronger than the S&P 500 which is overall a very positive development for the stock market. The IWM is above $114.00 indicating the potential of significant further gains. A breakdown below $105.00 would be troublesome turning into a false breakout instead of a party celebration. The bulls remain in control climbing the wall of worry.
I would love to hear from you. Please share your thoughts, comments or ask any question you might have. Call me at 516-829-6444 or send an email to bgortler@signalert.com.
*******Article in Systems and Forecasts June 10, 2016
Discover the right wealth building attitude…

Download a
Free chapter
of my book
Journey To Wealth
Disclaimer: Although the information is made with a sincere effort for accuracy, it is not guaranteed that the information provided is a statement of fact. Nor can we guarantee the results of following any of the recommendations made herein. Readers are encouraged to meet with their own advisors to consider the suitability of investments for their own particular situations and for determination of their own risk levels. Past performance does not guarantee any future results.


