Small and Mid-Caps Near Upside Objective: Further Gains In The Future?
 The stock market has been somewhat split since the election. Some sectors performed better than others. Investors sold consumer staples, health care, biotechnology and big cap tech stocks. It was an ugly month for bonds, as interest rates rose; yields soared, initiating heavy selling. The Barclays U.S. Aggregate Bond Market Index lost 3.6%, its worst showing in twelve years.
It wasn’t all doom and gloom, money rotated into energy, financials; mid and small cap stocks and they soared higher. As the major indices have moved to new highs, investors have become more optimistic as shown by the Investors Intelligence Sentiment readings (which are contrary indicators). As of 11/29/16 it showed 56.3 % Bulls and 22.3% Bears. These readings are not yet at extreme high levels where historically market peaks have formed, however they are not showing signs of pessimism as they did early in the year at the February lows.
Our market timing models remain overall neutral-positive, suggesting the potential for further gains. The tape action has improved in early December. It has now been almost 4 weeks since the election and it appears the next leg of the rally could be in process. (See the 11/10/16 Systems and Forecasts article “Wait for the Dust to SettIe”).
A few optimistic signs:
- Overseas markets have stabilized. The Ishares China (FXI), Emerging Markets (EEM) and Mexico (EWW) are all higher than the 11/09/16 close.
- Long term interest rates have stopped rising. TLT iShares Barclays 20+ Yr. Treasury Bond (ETF) is no longer making lows and has turned up.
- High Yield Bond Mutual Funds have stopped falling and have turned up from their lows.
I would like to see continued improvement in market breadth, more stocks making new 52 week highs, along with the big cap technology stocks joining the advance. Enjoy the rally for now but be ready with your exit strategy if market conditions change.
What Chart You Want To Watch Now:
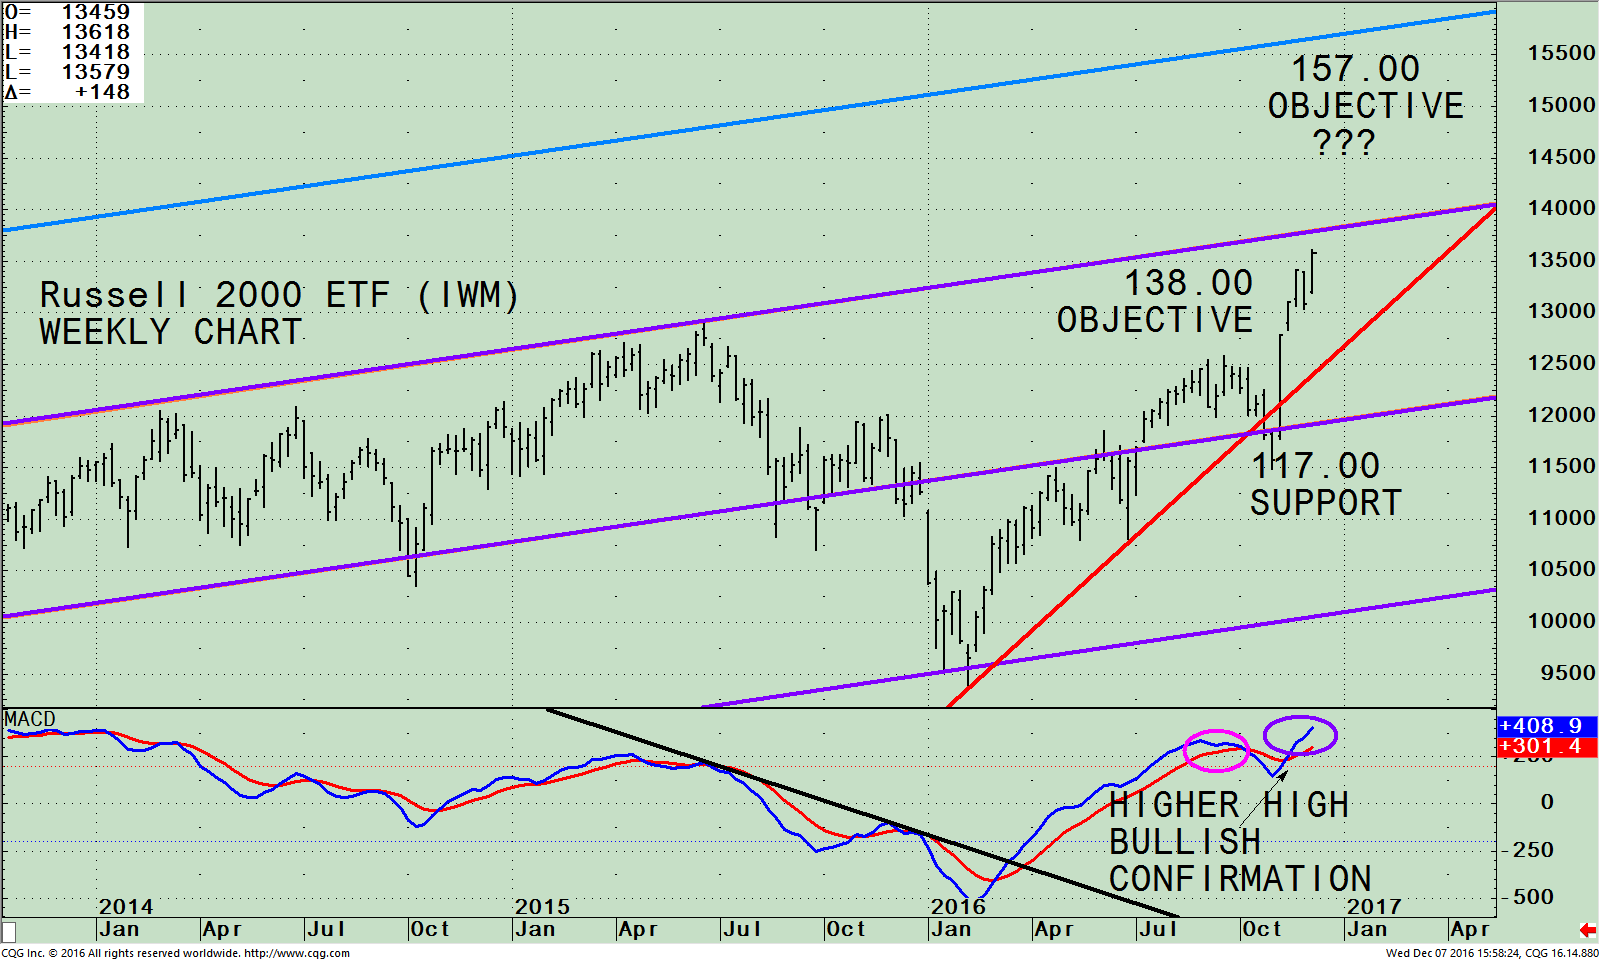
iShares Russell 2000 ETF (IWM) Weekly Price (Top), and 12-26-9 Week MACD (Bottom)

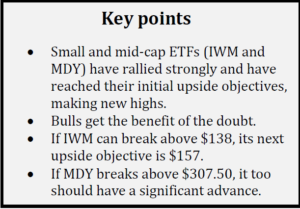
The top portion of the chart shows the weekly iShares Russell 2000 Index ETF (IWM) which is made up of companies with a market capitalization of between $300 million and $2 billion. The IWM failed to take out its high on 09/22/16, started to retrace it gains and then slightly penetrating support at 117.0. After the election the IWM skyrocketed. The IWM rallied 11% in November making a new high on 11/11/2016, and is less than 2% away from reaching its channel objective at 138.00. (See Systems and Forecasts 09/29/16 issue).
A break below short term support at 124.00 would change my bullish outlook. If the IWM closes above 138.00 for two days the likelihood would increase the odds that another leg up potentially to 157.00 is possible.
For confirmation of further strength keep an eye on the S&P MidCap 400 (MDY), which has been on a roll, achieving its first upside projection at 303.00. A break above 307.50, would confirm another leg up is likely.
The lower portion of the chart is MACD, (a momentum indicator). The entry was well-timed, rising sharply after breaking the short term down trend (black line). MACD is overbought, confirming the new high made in price. The bulls remain in control. The small caps (IWM) are stronger than the S&P 500 (SPY) for the intermediate and long term. I continue to expect small caps to outperform the S&P 500 (SPY) however there could be more volatility and potentially more risk investing in the IWM.
Summing Up:
Our models remain overall neutral-positive. December is a favorable seasonal period historically. Interest rates have stopped rising, bonds have stabilized, and overseas markets are heating up joining the advance. Market breadth is improving, small and midcaps are near their upper channel objectives, close to giving a higher projection, suggesting the market will continue to advance. If the IWM closes above 138.00 for two days the likelihood would increase that another leg up potentially to 157.00 is possible. The bulls remain in control. I remain optimistic the stock market will work its way higher into year-end and no serious decline will occur.
What level are you looking for the Russell 2000 (IWM) to reach?
Please call me at 516-829-6444 or email at bgortler@signalert.com to share your thoughts or ask me any questions you might have. I would love to hear from you.
If you like this article, then you will love this!
Click here for a free report: Top 10 investing Tips to More Wealth
*******Article in Systems and Forecasts December 08, 2016

Discover the right wealth building attitude…
Download a Free chapter of my book Journey To Wealth
Disclaimer: Although the information is made with a sincere effort for accuracy, it is not guaranteed that the information provided is a statement of fact. Nor can we guarantee the results of following any of the recommendations made herein. Readers are encouraged to meet with their own advisors to consider the suitability of investments for their own particular situations and for determination of their own risk levels. Past performance does not guarantee any future results.


