Do you think that this December may be like December 2018, where the major averages fell sharply? I do not believe the same will occur. The first few days in December have been a rocky start, the first decline since 10/3/19, after two months of steady gains. The Nasdaq this month is coming off its first three-day decline since September, during one of the most historically favorable months of the year.
Intermediate chart patterns on balance are positive, suggesting the decline is nothing more than a normal retracement after weeks of positive gains. The major averages on the S&P 500, Dow, and Nasdaq have held short term support levels. New all-time highs in the major averages were confirmed by the Advance/Decline on the New York Stock Exchange. The Russell 2000 Index (IWM), which had lagged in relative strength compared to the S&P 500, is showing signs of strength, breaking out over its September 2019 high. Risker sectors such as Biotechnology (XBI), Technology (XLK), and Semiconductors (SMH) remain in a weekly uptrend.
On the other hand, market breadth has weakened. The New York Stock Exchange (NYSE) and Nasdaq had more new lows than new highs on 12/3/19. International markets have been weakening after showing signs of strength, especially the Emerging markets. Market volatility has increased as the volatility index (VIX) that measures fear made a one month high. The risk remains if new U.S. tarriffs on China begin on December 15 as scheduled. Our market timing models imply further gains are likely. News headlines are moving the markets, adding to daily volatility. However, the positives outweigh the negatives. Continue to give the bulls the benefit of the doubt.
Where do we go from here?
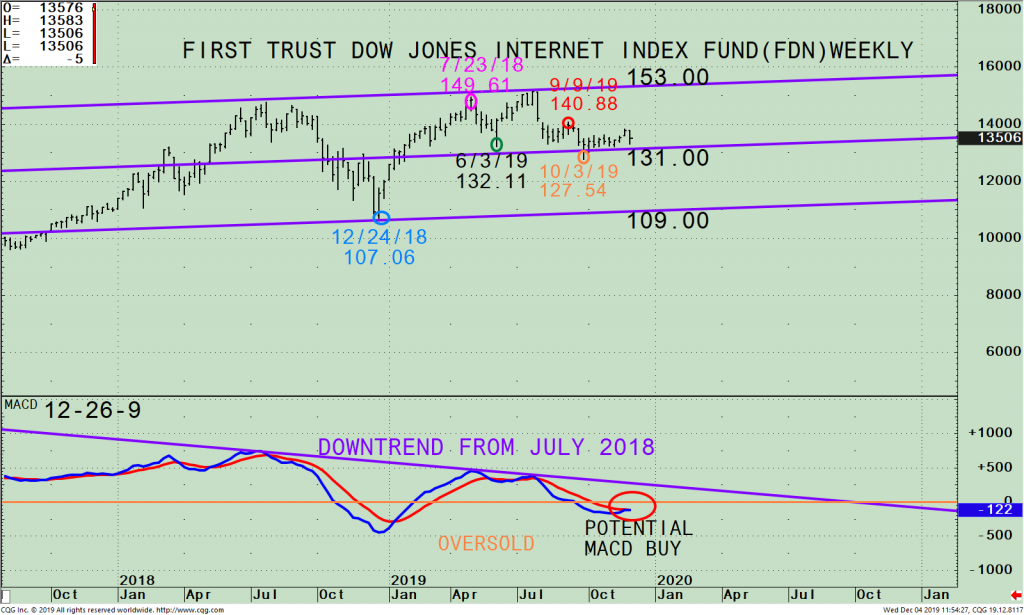
Figure: Weekly First Trust Dow Jones Internet Index Fund (FDN) Price (Top) and 12-26-9 MACD (Bottom)

The top portion of the chart shows the weekly (intermediate term) First Trust Dow Jones Internet Index Fund (FDN)1 ETF and its active price channels (purple lines).
FDN made a low last December with the other U.S. major averages at 107.06 on 12/24/18 (blue circle). A sharp rally followed, a gain of 28.4%, making a higher high then 7/23/18 at 149.61 (pink circle). FDN was unable to penetrate the upper channel and then declined 11.7% to 132.11 on 6/3/19 (green circle), slightly above the middle channel. FDN rose again, peaking at 151.35 on 7/29/19. Like the Russell 2000 (IWM), and the Dow Transportation Average (IYT), the FDN has not penetrated the high. However, in November, FDN has begun to show indications higher prices may lie ahead, and the underperformance may soon end.
A sign of more upside in the near term will be if FDN begins to gain upside momentum. Evidence that this is happening will be if FDN daily price change begins to consistently be stronger than the S&P 500 and Nasdaq. Be aware that FDN is riskier, more volatile than QQQ and S&P 500. A weekly close above 140.88 (approximately 4% higher), the 9/9/19 high (red circle), would be bullish for the internet sector and could fuel the Technology sector. A weekly close below the 10/3/19 low at 127.54 would negate my positive outlook.
The bottom half of the chart is the 12, 26, 9-week MACD, a technical indicator that measures momentum. MACD has a promising pattern, where it’s no longer pointing down and is close to generating a new buy, which could happen over the next few weeks if FDN continues higher. Keep an eye out if MACD breaks the downtrend from July 2018 (purple line); this would confirm downside momentum is complete.
Summing Up:
Market technicals are mostly favorable as the market climbs the wall of worry. If the major averages continue to hold support, it’s likely the month of December will move higher. Investors will want to participate if new record highs are made instead of fear of missing out (FOMO) into year-end. Window dressing by institutions is also likely as they want to show winning stocks in their portfolios. The underperformance in the internet sector may be coming to an end. A weekly close above 140.88, (approximately 4% higher), would be bullish for the Internet sector and have a positive effect on the Technology sector. On the other hand, a weekly close below the 10/3/19 low at 127.54, would imply a more cautious outlook is warranted.
I would love to hear from you. Please call me at 516-829-6444 or email at bgortler@signalert.com to share your thoughts or ask me any questions you might have.
The First Trust Dow Jones Internet ETF tracks the performance of the Dow Jones Internet Composite Index, which includes the 40 largest, most actively traded U.S. internet stocks. As of 12/2/19, the top five holdings of FDN are Amazon.com Inc (AMZN) 9.03%, Facebook Inc (FB) 8.02%, Cisco Systems Inc (CSCO) 5.18%, Salesforce.Com Inc (CRM) 5.09%, and Netflix Inc (NFLX) 5.09% totaling 32.41%. The top two sectors are Technology 42.00 %, and Communications 29.00% totaling 71.00 %. Source: https://etfdb.com/etf/FDN/
Sign up for a FREE 3 issue trial of
SYSTEMS AND FORECASTS Click here

If you like this article you will love my
Free EBook Grow Your Wealth and Well-Being
******Article first published in Systems and Forecasts on December 4, 2019
Disclaimer: Although the information is made with a sincere effort for accuracy, it is not guaranteed that the information provided is a statement of fact. Nor can we guarantee the results of following any of the recommendations made herein. Readers are encouraged to meet with their own advisors to consider the suitability of investments for their own particular situations and for determination of their own risk levels. Past performance does not guarantee any future results.


