The first half of 2013 has been one of the best for our stock market even with June being a down month. High volatility continued in both the US, world, and bond markets. Selling pressure continued in the international markets, but prices finished above their lows of the month. Bonds also had challenging times with Treasury rates rising to levels not seen since August 2011 almost 1% higher than last year. Bond mutual funds had huge outflows in June. High yield mutual funds and other bond ETF’s products were also under selling pressure.
Gold has had large trading swings. Prices plunged, falling to levels not seen since August 2010. The SPDR GLD Gold Trust ETF(GLD) fell to the first downside objective of 117 mentioned in the May 21st newsletter followed by a short term reflex rally with prices now at 120.13, but so far no bullish conviction. The full downside objective remains at 105 (See chart at right). I believe it’s too early for a meaningful rally of significance in (GLD).Although we are oversold, momentum oscillators don’t appear ready for a change in trend. Relative strength is still weak, MACD patterns are not favorable and no positive divergence is in place. A break above 125 in GLD would suggest prices to further rally to 132.50.
What are the charts saying for the US market?
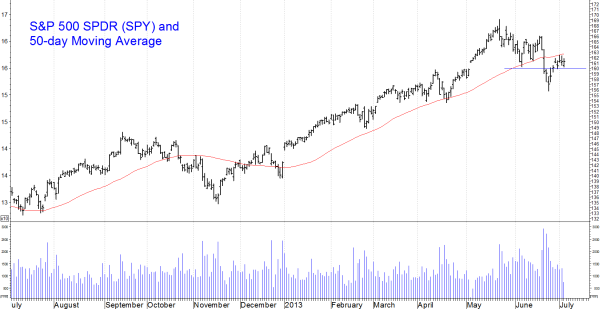
Let’s look at the Daily S&P 500 SPDR (SPY) chart.
The S&P 500 was volatile in late June with the S&P falling over 1% two days in a row, breaking short term support of 159, (adjusted for its dividend paid on 06/21), moving lower, to an intraday low of 155.73. The S&P 500 traded below its 50 day moving average, stabilized, then reversed up beginning a new short term advance with a high of 162.48 as of this writing (July 3). The rally failed at resistance close to the downtrend line from the May peak. It was not a good sign when it could not penetrate the 50 day MA on the retracement. (Editor’s note: SPY closed at its 50-day moving average on July 5.)
It appears that the July 5 rally will generate an MACD buy signal and short-term trendline break to the upside (both bullish). It would be even more bullish if there would be a break above 165.00. This would change the short term trend from down to up.
Market Technicals are Weakening: Short and Intermediate Term Downtrends are Likely to be Contained
The International Market Outlook
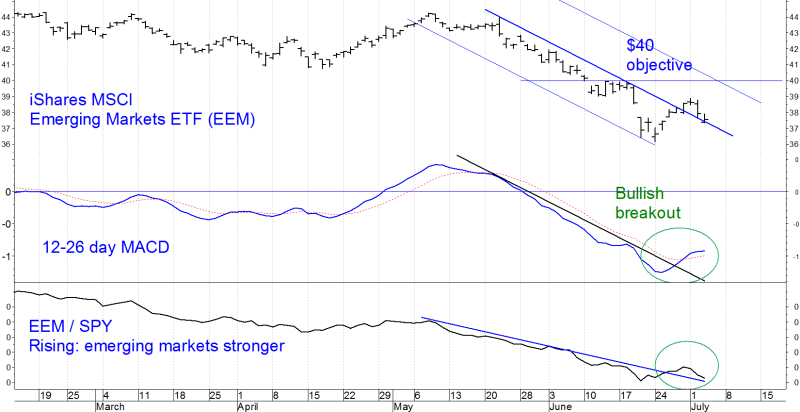
Looking at the Daily Emerging Market iShares MSCI Emerging Markets Index ETF (EEM) Chart:
The Emerging Markets (EEM), has been weak closing at 44.35 December 31 2012, out of favor in compared to the US market, trading in a down trend since May. A rally occurred, but failed, followed by another decline to a low of 36.16 on June 16th. The top 4 countries in EEM and percentage holdings as of July 1 is China 17.44%, South Korea 14.46%, Taiwan 11.68%, and Brazil, 11.09%.
It is possible a short term bottom has taken place. Notice the MACD is oversold, has turned up and the short term down trend has been broken. The real test now is whether we can hold above the breakout line of the downtrend. This would be bullish if we could rally from here. Short term objective is 40.00, a 20% upside potential.
There is also a small change in the relative strength ratio of the SPY/EEM relationship on the daily chart. The relative strength of EEM turned up and broke its downtrend line at the same time as the price of EEM itself. If strength develops in emerging market stocks, this would help the US market remain stable and ultimately go higher.
Just to sum up
Our long term models remain on buy signals, suggesting downside risk is likely to be contained even though we are in an unfavorable seasonable time frame for the market. The charts show the market still in a short and intermediate term down trend, but many monthly charts remain positive. New lows were increasing but are now at very low levels. The defensive groups such as telecommunications and utilities have stabilized for now. Apple Computer (AAPL) has all of a sudden come to life. It would be very bullish if concerns over the Fed ending its quantitative easing disappear, the Emerging Market area comes to life, and the Nasdaq becomes a market leader over the S&P 500 so we could once again challenge the highs. As long as we hold above 153 on the SPDR S&P 500 ETF (SPY), I will give the market the benefit of the doubt for now however I do recommend reviewing your portfolio and evaluating your risk vs. the reward potential so that you are prepared for the unlikely event that the decline gets more serious than is expected.
Sign up now to receive FREE REPORTS about investing
including “Market Outlook 2013” at Signalert.com
This material is not intended to be, nor should it be used as, financial, legal, tax or investment advice nor an opinion or recommendation by Signalert Asset Management (“Signalert”) regarding the appropriateness of any investment. This material does not take into account the particular investment objectives or financial circumstances of any specific client or type of client. Signalert’s products may not be suitable for all clients. No representation or guarantee is made that a client is likely to achieve his or her investment objectives through investing with Signalert, or will be profitable or will not sustain a loss. Past performance is not indicative of future results.
To discover how to achieve your financial dreams click here
Visit www.BGJourneyToWealth.com for more insights to growing your wealth!

Bonnie Gortler (@optiongirl) is a successful stock market guru who is passionate about teaching others about social media, weight loss and wealth. Over her 30-year corporate career, she has been instrumental in managing multi-million dollar client portfolios within a top rated investment firm. Bonnie is a uniquely multi-talented woman who believes that honesty, loyalty and perseverance are the keys to success. You will constantly find her displaying these beliefs due to her winning spirit and ‘You Can Do It’ attitude. Bonnie is a huge sports fan that has successfully lost over 70 pounds by applying the many lessons learned through her ongoing commitment toward personal growth and development while continually encouraging others to reach their goals & dreams. It is within her latest book project, “Journey to Wealth”, where Bonnie has made it her mission to help everyone learn the steps needed to gain sustainable wealth and personal prosperity. Order your copy of ”Journey to Wealth” today!
- Subscribe to BonnieGortler.com
- Connect with Bonnie via LinkedIn, Twitter & Facebook
- Put a smile on someone’s face and Send a card on Bonnie!
- Choose your very own FREE down-loadable gift by visiting bit.ly/bgoffers
Like this post? Feel free to use it in your blog or ezine as long as you use the above signature in its entirety


