December Lows Hold, Signifying That Potentially Higher Stock Market Prices Lie Ahead
“Time is money.” —Benjamin Franklin
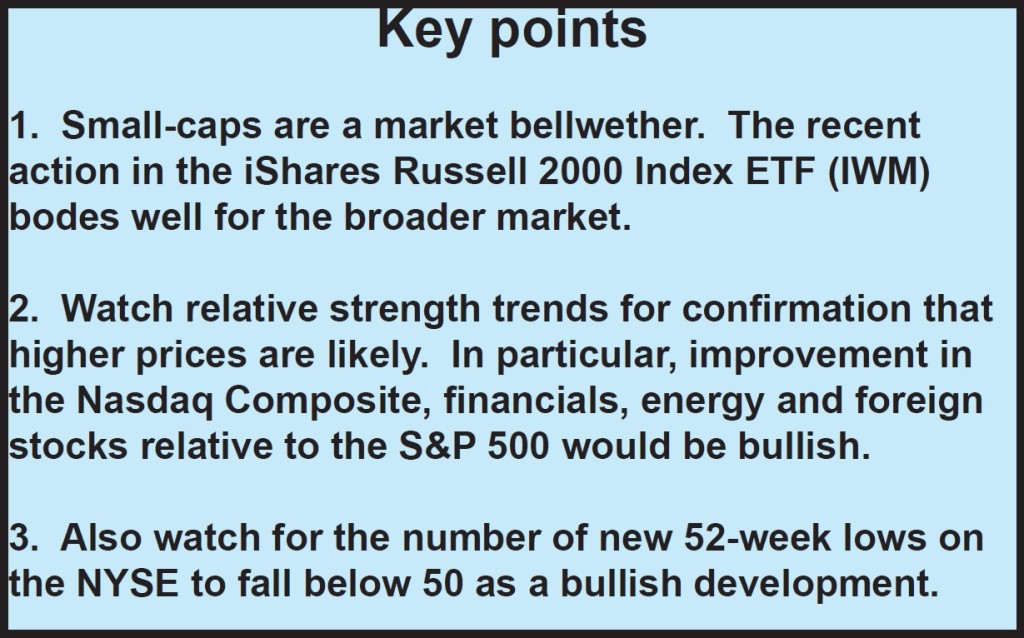
The stock market had a rough beginning to the New Year, a sea of red on the screens (indicating lower prices) instead of green. Stock market volatility continues with heavy pressure from falling oil prices, continued weakness overseas, concern over the European economy combined with investors taking profits from 2014. Volatility in 2015 is likely to rise to more normal volatility level instead of very low readings that took place in 2014. With the Fed expected to raise interest rates as the year moves on, wider up and down swings in the market could occur, making investing even more challenging, but with more opportunities to take advantage of.
Major indexes such as the S&P 500 (SPY) were overbought, trading near the top of their trading channels. When they were unable to get through, the rally stalled, and prices started to decline at the end of 2014 and starting the New Year. The good news is prices have held the December lows as of January 7, 2015 and the market is short- term oversold. The market appears to have bottomed after a quick pullback, ready for another advance to begin. Time will tell if this is a significant bottom and the start of another rally to challenge the old highs again, or if the rally will last for only a few days, and then the selling starts again. Although I am concerned about a fresh round of selling, our trading models remain positive, suggesting that risk should be contained even if a decline does take place from here.
Some Key Observations To Look for That Would Signal Higher Prices
 • The S&P 500 (SPY holds 197.86 the December low, and goes back above the 50-day moving average which is approximately in the 205.00 area, where old support was, but is now
• The Russell 2000 (IWM) penetrates in the short term above 117, and then takes out the highs from 12/29/14 penetrating 122.00. The Russell 2000 (IWM) continues to be stronger compared to the S&P 500 – (see chart below).
• Nasdaq has lost its leadership to the S&P. It would be bullish for the Nasdaq to retake leadership over the S&P 500 (SPY).
• It would be best if the Financial Select Sector SPDR (XLF) ETF which has been under some selling pressure as of late could firm, and gain leadership in relative strength to the S&P 500 (SPY).
• Foreign stocks stop falling. Look for the improvement in the EAFE international stock index (EFA), which is a benchmark of the performance of indexes from Europe, Australia and Southeast Asia. Emerging markets (EEM) to stabilize, start rising, and form an uptrend with prices making higher lows instead of lower lows.
• Energy (XLE) holds the December low of 72.51 stabilizes and goes higher.
• Gold prices stall, and fall again. Unfortunately for equity bulls, gold does have favorable chart patterns on a weekly and monthly basis.
• New lows on the New York Stock Exchange Index shrink to under 50 which would imply safer market conditions.
• The high yield bond sector (HYG) and hi yield mutual funds stabilize, and move higher.
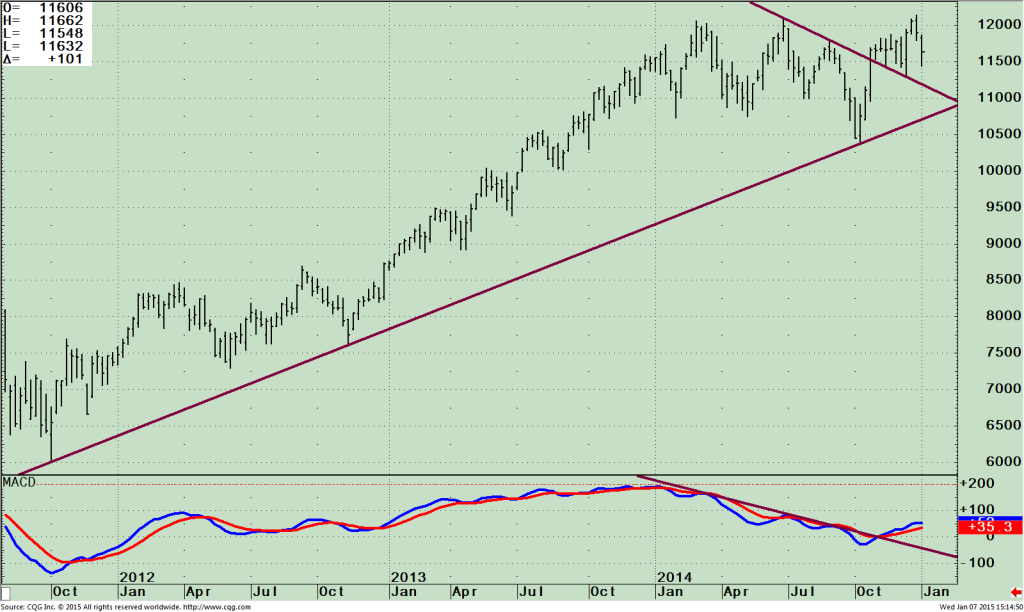
The IShares Russell 2000 (IWM) ETF Weekly
 The top half of the chart (right) shows the price of the Russell 2000 (IWM) ETF weekly uptrend in effect. This sector was out of favor in 2014 but has held up reasonably well in this recent decline. Prices remain above levels from where the breakout occurred. As long as prices stay above 111.00 the breakout is intact. I would become very cautious about the overall US market if prices break below 105.00. If this does happen prices could move as low as 95.00 if the October low is violated.
The lower portion of the chart above is MACD – a momentum indicator. MACD broke its down trend in October 2014, has been rising. Notice how it’s now started to flatten. It would be more bullish if MACD could turn up from here.
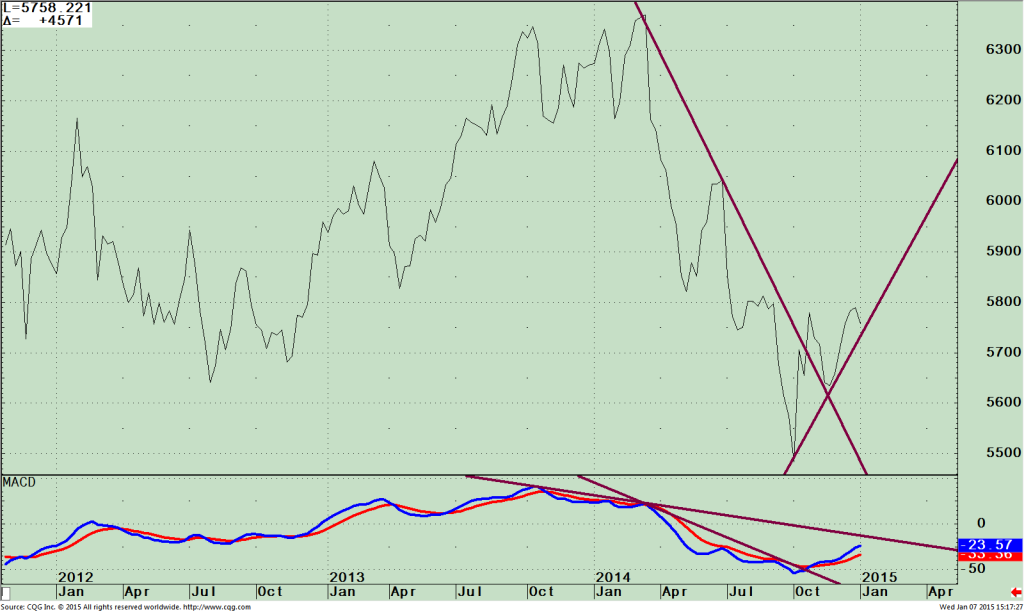
Russell 2000/S&P 500 (IWM/SPY) Weekly Relative Strength
 The top half of the chart (right) shows the relative strength of the Russell 2000 (IWM) compared to the S&P 500 (SPY). Rising means IWM is stronger and falling means S&P 500 is stronger. Notice how IWM/SPY held the uptrend line that began in early October, which I am interpreting as positive. Even though IWM has lagged SPY since the start of the year, I give the Russell 2000 (IWM) the benefit of the doubt that it will turn back up from here.
The lower portion of the chart shows MACD rising from below 0 and close to breaking a long term downtrend from 2013. If and when this occurs this would be bullish.
Just To Sum Up:
The stock market looks like the recent decline is over. December lows in many averages, even the weaker ones, appear to have held. Bullish signs would be if oil prices, international markets, small caps and financials rise. If prices firm in the major averages, another leg up towards new highs and higher objectives is a real possibility. If the December lows are violated in the S&P 500, (197.86) and 197.00 is penetrated, lower price objectives would be given and risk would increase. As of now, it looks like the bulls are back in control, December lows will hold and potential higher prices lie ahead
I invite you to share your stock market insights by calling me at 1-844-829-6229 or Email me at bgortler@signalert.com with your questions or comments.
Wishing you and your loved ones health, wealth and happiness! ~Bonnie
Grab your Free 3 Issue Trial of the Systems and Forecasts newsletter where I am the Guest Editor http://bit.ly/1fM79hp


