After the S&P 500 fell nearly 6% in two days in late June, the S&P 500 rebounded almost 9%, to a new all-time high in July.
The rally was broad based. Technology, small cap, midcap and the international indices also had large gains. Since the rally, the market has quieted, moved mostly sideways, only giving up a small portion of their gains, working off the overbought condition that had developed after the rise.
Market breadth has been extremely strong. This type of strength in market breadth rarely happens at an ultimate price high or at a market top. The advance/decline line has confirmed the recent high, a very encouraging sign of further gains potentially ahead. More positive evidence supporting the overall stock market that doesn’t occur very often is the ratio of advancing volume to declining volume exceeded 9:1 four times over 11 days on June 23 through July 8.
In addition, our models remain favorable suggesting any decline would be contained to only 2-4% lower if a pullback does occur.
Keep an eye on the market action in the following sectors; crude oil, high yield bonds, Nasdaq and small caps.
The best case scenario would be oil stabilizing after falling sharply recently, high yield bonds turning up again rising to new highs after some recent weakness, and riskier areas such as Nasdaq and small caps to be stronger than the S&P 500. These developments would fuel the market higher confirming the strength in market breadth.
What Are The Charts Saying?
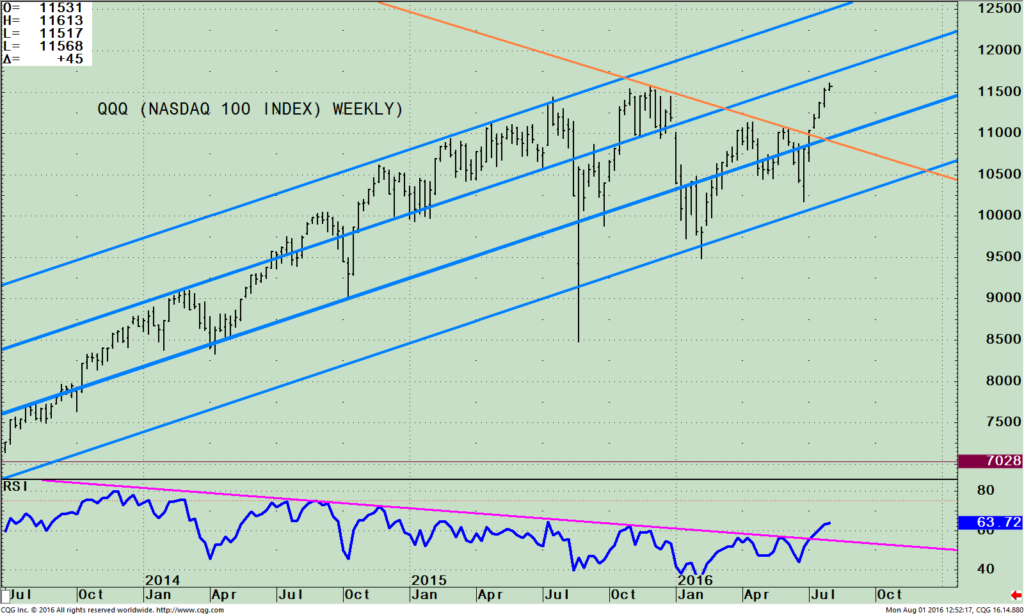
QQQ (Nasdaq 100 Index) Weekly Price and Trend Channels (Top), and RSI 14 (Bottom)
The market continues to climb the wall of worry.

The top part of the chart shows the weekly Nasdaq 100 (QQQ), an exchange traded fund (ETF) representing the Nasdaq 100 Index, along with price and trend channels that are acting as support and resistance areas. QQQ includes 100 of the largest domestic and international nonfinancial companies listed on the Nasdaq stock market based on market capitalization.
As of 08/01/16, Apple, (AAPL) is the largest holding comprising 10.52%, Microsoft Corp (MSFT) 8.05%, Amazon.com, Inc. (AMZN) 6.56%, Facebook, Inc. Class A (FB) 5.20%. Alphabet Inc. Class C (GOOG) 4.81% and Alphabet Inc. Class A (GOOGL) 4.26% totaling 39.40%.
Notice that QQQ has traded within the channel (blue lines) since July 2013, except for a one day blip that occurred in August 2015, where the QQQ tested the lows falling below the channel line. The recent rally was very strong once the QQQ penetrated the downtrend (orange line) and broke through key resistance at 111.00. Investors’ buy stops were tripped, fueling the rally. The old resistance at 111.00 is now key support. It’s best the QQQ stays above this level.
The next resistance is a few percent above at 117.50, (the blue channel line), followed by 125.00.
A break below 107.50 would negate my positive outlook.
The lower portion of the QQQ chart on page 2 shows the Relative Strength Index, a measure of momentum developed by Welles Wilder.
RSI is based on the ratio of upward price changes to downward price changes. The down trend in RSI from June 2014 has been broken (pink line); a sign indicating that QQQ is gaining momentum and potential further strength lies ahead.
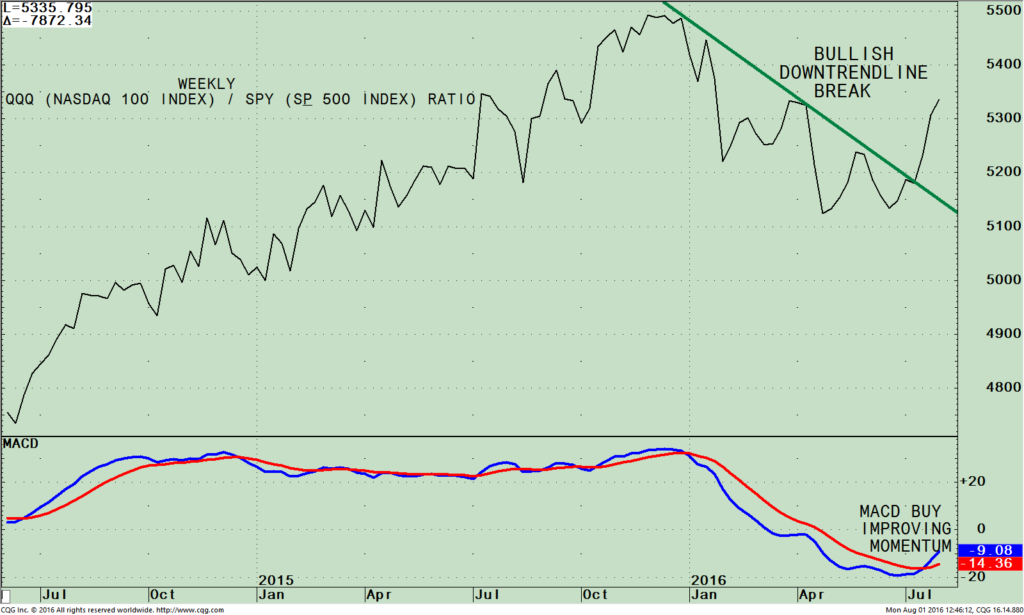
Weekly QQQ (Nasdaq 100 Index) / (SPY) S&P 500 Index Ratio (Top), and 12-26-9 Week MACD (Bottom)

The chart below is the weekly Nasdaq 100 /S&P 500 ratio (QQQ/SPY). A rising line means the QQQ is stronger, and if falling, the S&P 500 is stronger. Historically, when QQQ is strong it’s a bullish condition for the broad market. It’s much easier to make money on the long side when Nasdaq is leading in relative strength.
In February the (QQQ/SPY) ratio turned down giving a warning of deteriorating momentum in the technology sector, exactly what occurred. Notice the bullish downside trendline break in the top chart. QQQ had been lagging the S&P 500 in 2016, however, in July a shift occurred. The Nasdaq accelerated higher, gaining 6.60% vs 3.56% for the S&P 500.
The bottom half of the chart shows MACD, a measure of momentum on the (QQQ/SPY) ratio.
MACD generated a buy from an oversold condition and its momentum is improving, bullish.
Technology has been out of favor a good part of 2016, however, it’s looking like a much better investment now.
I am expecting more Nasdaq strength vs. the S&P 500 going forward.
More Bullish Evidence:

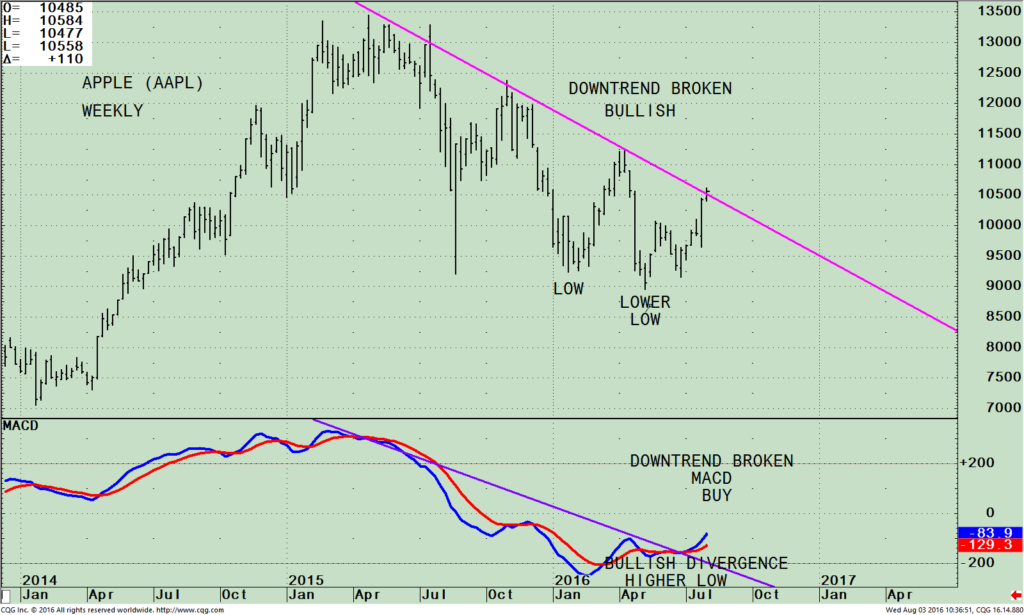
Weekly Apple (AAPL, top) and 19-26-9 week MACD (Bottom)
Apple has been out of favor by investors and under continuous selling pressure since its high in April 2015).
Notice the lower low in price in May 2016. Now Apple, (AAPL) the largest holding in the Nasdaq 100 (QQQ), has slightly penetrated its down trend (See top part of the chart below) and is gaining momentum (lower chart).This is bullish.
The bottom part of the AAPL chart has clearly broken the MACD downtrend since the April 2015 (purple line).
In addition, MACD has formed a very favorable pattern, a rising double bottom.
See the bullish divergence: AAPL price made a new low in May, but MACD did not fall as far down in May as it had in January.
Summary
Market breadth has been extremely strong. This type of strength in market breadth rarely happens at an ultimate price high or at a market top.If institutions and investors continue to add to their investments this would help the technology sector.
Our models remain favorable. Look for oil stabilizing, high yield bonds turning up again and riskier areas such as Nasdaq and small caps to be stronger than the S&P 500 to fuel the market higher. Bullish evidence in intermediate term patterns on the Nasdaq (QQQ) and positive divergences in Apple will fuel the advance with the expectation that the technology sector will be stronger than the S&P 500 as the market moves higher climbing the wall of worry.
I would love to hear from you. Please share your thoughts, comments or ask any question you might have.
Call me at 1-516-829-6444 or send an email to bgortler@signalert.com.
*******Article in Systems and Forecasts August 4, 2016

Discover the right wealth building attitude…
Download a
Free chapter
of my book
Journey To Wealth
Disclaimer: This is a hypothetical result and is not meant to represent the actual performance of any particular investment. Future results cannot be guaranteed. Although the information is made with a sincere effort for accuracy, it is not guaranteed either in any form that the above information is a statement of fact, of opinion, or the result of following any of the recommendations made herein. Readers are encouraged to meet with their own advisors to consider the suitability of investments discussed above for their own particular situations and for determination of their own risk levels.


