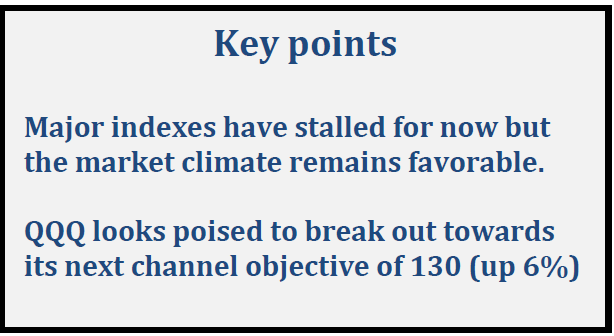
 The first week of 2017 was strong after many major averages made new highs in December. Since that time major averages have paused, digesting their gains. The Dow Industrials has come close a few times to the key psychological 20,000 level, however so far unable to push through. The Russell 2000 (IWM) peaked just above its upside objective at 138.00 and the S&P Mid-Cap 400 (MDY) also made its upside objective at 307.50, however then pulled back. When the Dow closes above 20,000 there is a good chance other indices will also move higher, surpassing their old highs.
Our stock market timing models remain neutral-positive indicating a potentially profitable market climate. The overall technical picture of the market remains positive. The cumulative advance decline line of the NYSE advance/decline line confirmed the highs made in December. When market breadth confirms price, usually that suggests the final high has not been made. It was also a good sign that there were 490 daily new highs on the NYSE on December 8, the most since May 2013. These types of readings are more bullish than bearish and suggest higher prices going forward. It’s also bullish that the Nasdaq Composite is now leading in relative strength vs the S&P 500, a condition which has historically overall characterized more profitable market climates.
Watch The Direction of Technology:
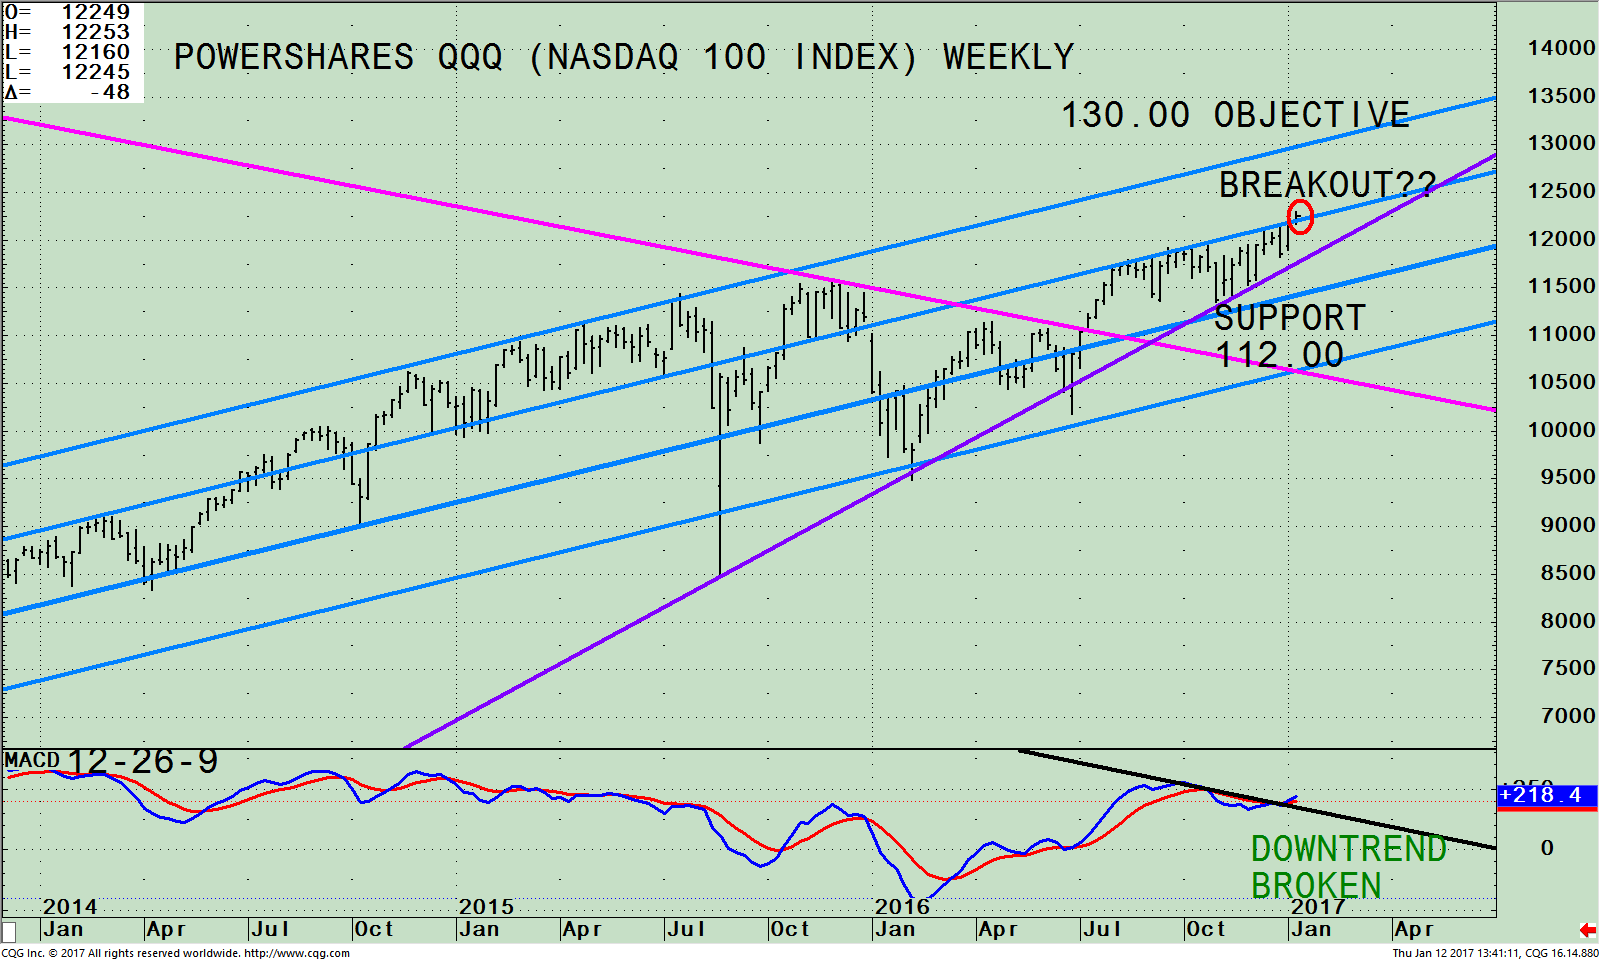
PowerShares QQQ ETF (Nasdaq 100 Index) Weekly Price and Trend Channels (Top), and MACD 19-26-9 (Bottom)

The top part of the chart shows the weekly Power Shares 100 (QQQ), an exchange-traded fund based on the Nasdaq 100 Index and its trend channels. The QQQ includes 100 of the largest domestic and international nonfinancial companies listed on the Nasdaq stock market based on market capitalization. As of 01/10/17, Apple, (AAPL) is the largest holding comprising 10.87%, Microsoft Corp (MSFT) 8.53%, Amazon.com, Inc. (AMZN) 6.47%, Facebook, Inc. Class A (FB) 4.98%. Alphabet Inc. Class C (GOOG) 4.75% and Alphabet Inc. Class A (GOOGL) 4.19% totaling 39.79%.
All the top holdings have rebounded this year after being out of favor before the election. The QQQ rose 7 straight sessions, closing at a new all-time high. With its recent strength, it looks like the QQQ could break out from here, (red circle above).
The upside channel objective is 130.00 (top blue channel line).
For now, the trend is our friend, however later this year could be more challenging as the market is in the late stages of a bull market. As long as the QQQ is above the retracement line from the break out of 112.00 in July 2016 (pink line), now acting as support, periodic declines most likely will be buying opportunities. A break below 112.00 would be considered bearish and suggest a more serious market decline.
Keep an eye on Apple, (AAPL) the largest holding of QQQ which has a favorable monthly MACD pattern turning up from an oversold condition, after breaking its downtrend in September 2016 (chart not shown). This has favorable implications for the technology area over the next several months.
The bottom half of the chart is MACD (12, 26, 9) a measure of momentum. MACD has broken its down trendline which is favorable; however MACD is not in its most ideal buying position as the turn up didn’t occur from an oversold condition below 0. This pattern needs to be monitored to see if MACD continues to rise further making a new high picking up momentum, as did the weekly MACD on the Russell 2000 (IWM) from October 2016 – December 2016.
Summing Up:
The overall trend of the market remains optimistic even though the Dow Industrials has been unable to get through the key psychological 20,000 level. Maybe earning season that begins 01/13/17 will be the fuel that is needed to get through the level. Upside channel objectives have already been met on the Russell 2000 Small Cap (IWM) and the SPDR S&P Mid Cap 400 (MDY). So far the pullback has not jeopardized the bullish outlook. In the meantime the Nasdaq 100 (QQQ) was up seven days in a row, reaching a new all-time high and has slightly penetrated its channel suggesting a possible breakout will occur. Look for strength in the Nasdaq 100 (QQQ) to lead the overall market higher. As long as the QQQ remains above the retracement line from the break out in July 2016 (pink line) above 112.00, intermittent declines most likely will be buying opportunities.
I would love to hear from you. Please call me at 516-829-6444 or email at bgortler@signalert.com to share your thoughts or ask me any questions you might have.
If you like this article, then you will love this!
Click here for a free report: Top 10 investing Tips to More Wealth
*******Article in Systems and Forecasts January 13, 2017
Discover the right wealth building attitude…
Download a Free chapter of my book Journey To Wealth
Disclaimer: Although the information is made with a sincere effort for accuracy, it is not guaranteed that the information provided is a statement of fact. Nor can we guarantee the results of following any of the recommendations made herein. Readers are encouraged to meet with their own advisors to consider the suitability of investments for their own particular situations and for determination of their own risk levels. Past performance does not guarantee any future results.


