

Bonnie’s Market Update 4/11/25
04/13/2025
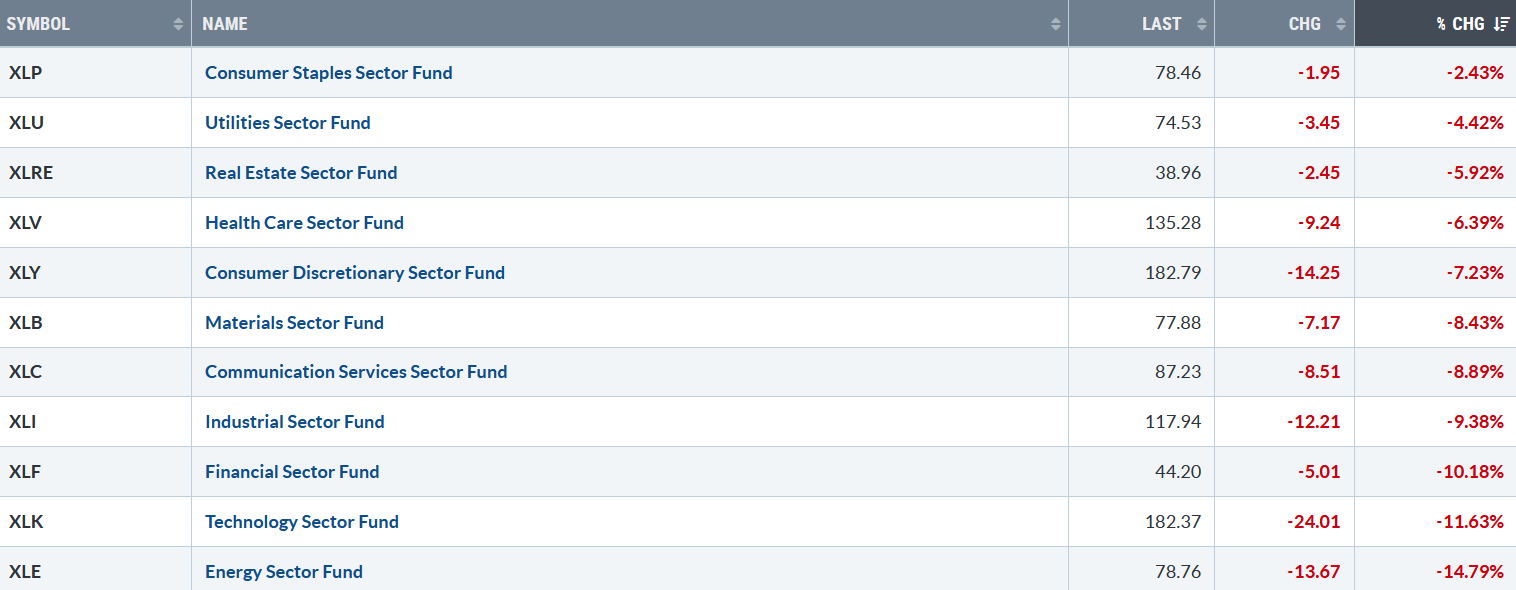
It was an ugly week, one of the worst weeks in market history. All eleven S&P SPDR sectors were lower last week. Consumer Staples (XLP) and Utilities (XLU) fell the least, while Technology (XLK) and Energy were the weakest sectors. The SPDR S&P 500 ETF Trust (SPY) dropped -9.09%.
S&P SPDR Sector ETFs Performance Summary 3/28/25 – 4/04/25
040425 weekly SPDR Sectors
Source: Stockcharts.com
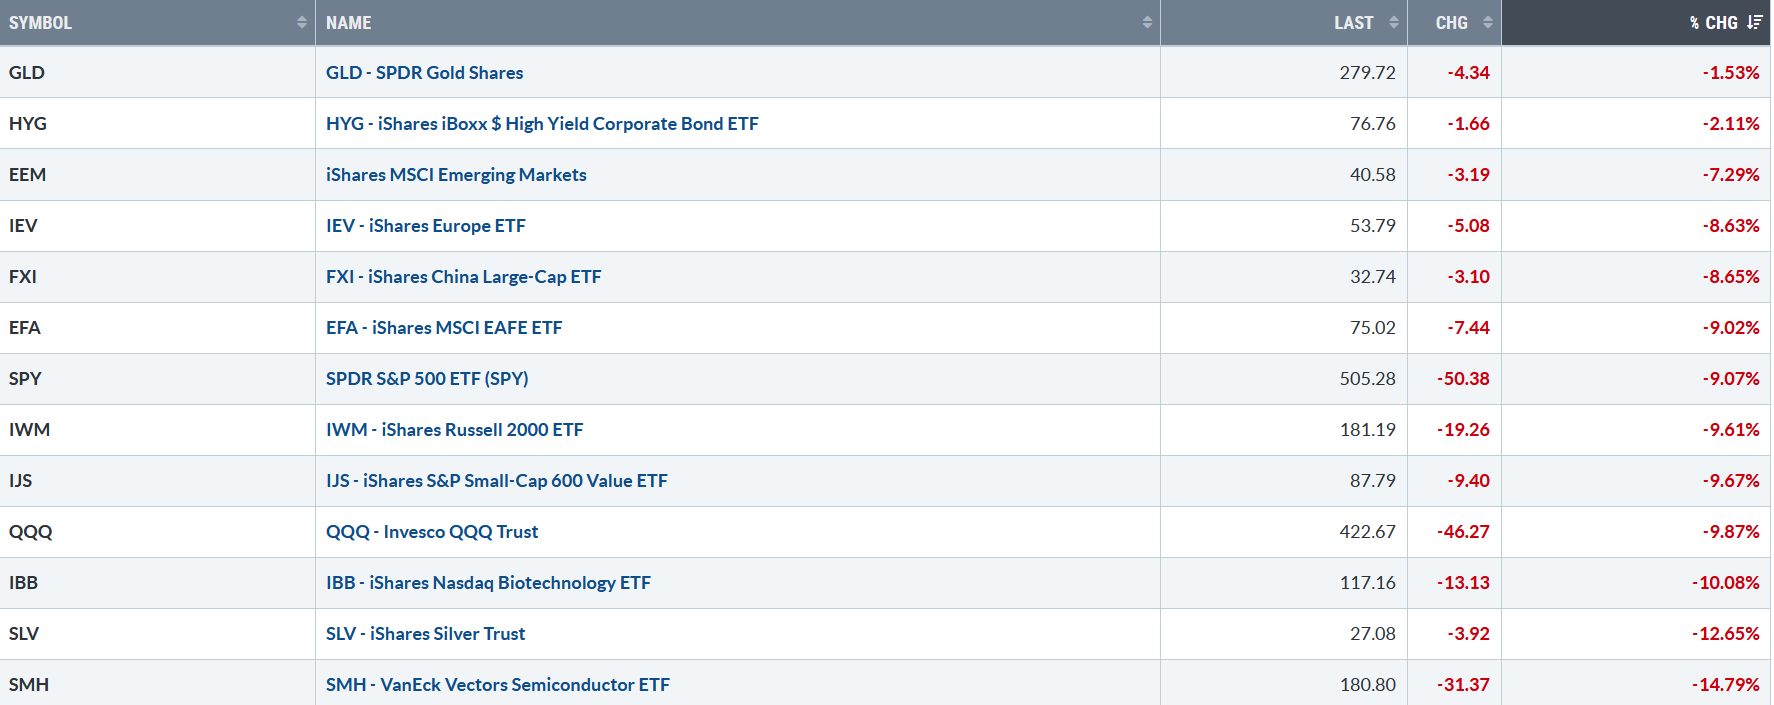
Figure 2: Bonnie’s ETFs Watch List Performance Summary 3/28/25 – 4/04/25
040425 Bonnie’s ETF Watch List
Source: Stockcharts.com
There was no place to hide last week. Semiconductors fell sharply, and Technology, Small-Cap Growth, Value, Silver, and Biotechnology were all under selling pressure.
CHARTS CHARTS AND MORE CHARTS FOR YOU TO REVIEW. GO HERE.
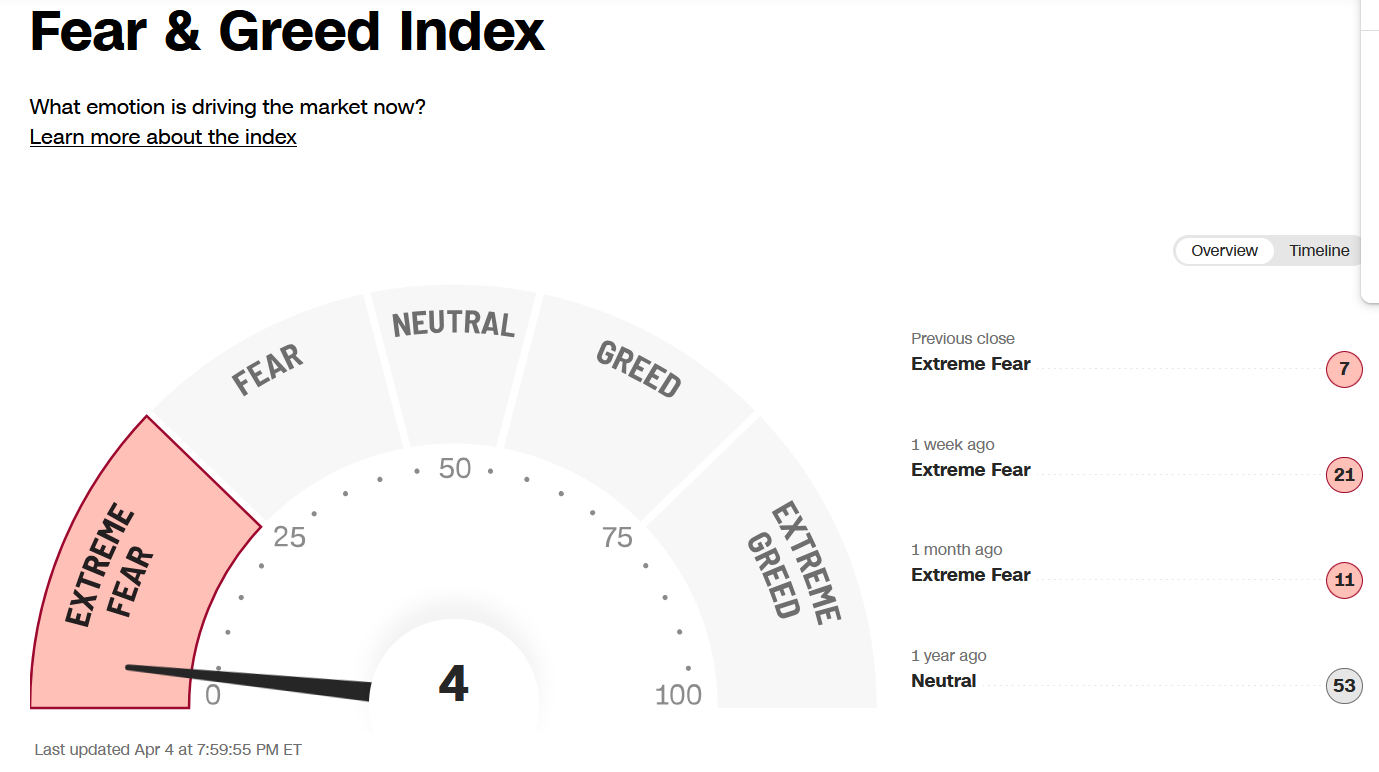
Figure 3: Fear & Greed Index
040425 CNN Fear and Greed
Source. CNN.com
Investor sentiment, measured by the Fear and Greed Index (a contrarian index), closed at 4, falling further in the extreme fear zone. There is no sign of a rally yet, but often, where good buying opportunities arise.
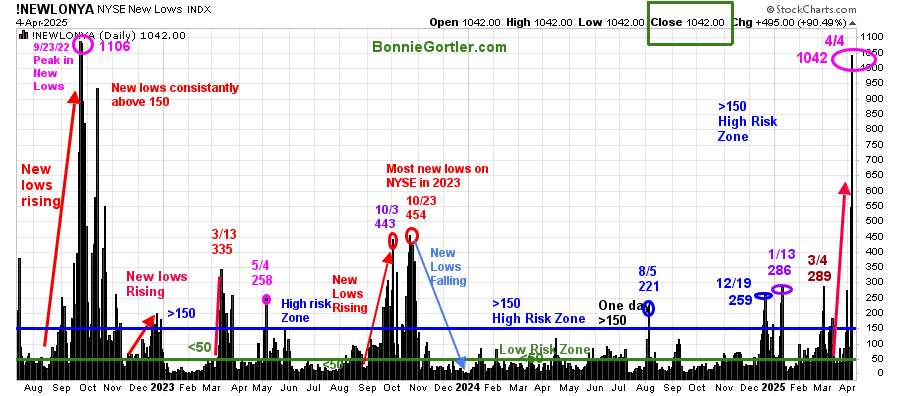
Figure 4: NYSE New Lows
040425 NYSE New Lows
Source: Stockcharts.com
New Lows on the NYSE rose in December 2024, with a high of 259. They briefly contracted before peaking at 286 (purple circle) on 1/13/25 and then contracted.
New lows in 2025 have hit high risk a few times and then contracted. New Lows continued to rise last week and exploded, closing in the high-risk zone at 1042 (pink circle), the highest since 9/23/22.
Watch New Lows to see if New Lows remain above 150, implying an increased risk of further downside, or if they start to contract and fall below 150, which would be a positive sign in the short term.
Learn more about the significance of New Lows in my book, Journey to Wealth, published on Amazon. If you would like a preview, get a free chapter here.
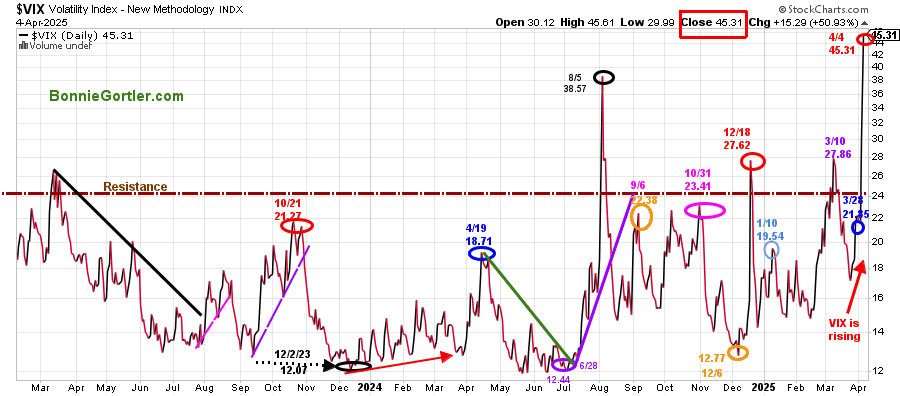
Figure 5: CBOE Volatility Index (VIX)
040425 VIX Daily
Source: Stockcharts.com
The CBOE Volatility Index (VIX), a measure of fear, rose sharply last week as stocks were hit hard, increasing from 21.65 (blue circle) to close at 45.31 (red circle), its highest closing reading since April 2020. Expect intraday volatility to be high.
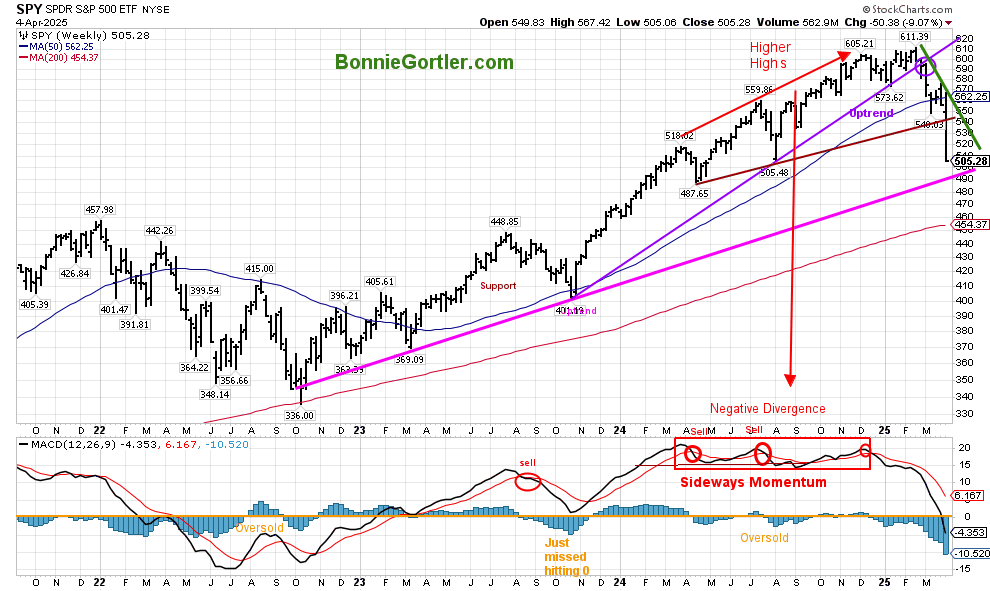
Figure 6: S&P 500 Weekly (SPY)
040425 SPY Weekly
Source: Stockcharts.com
The S&P 500 SPY (top chart) remains in an intermediate downtrend. Last week, it made a new intermediate momentum low, the lowest since 2023. If the SPY closes below 490.00, the 2022 uptrend will be in jeopardy.
MACD (bottom chart) is falling, oversold, and below 0. MACD has made a new momentum low for the year, implying more time is necessary for an intermediate bottom.
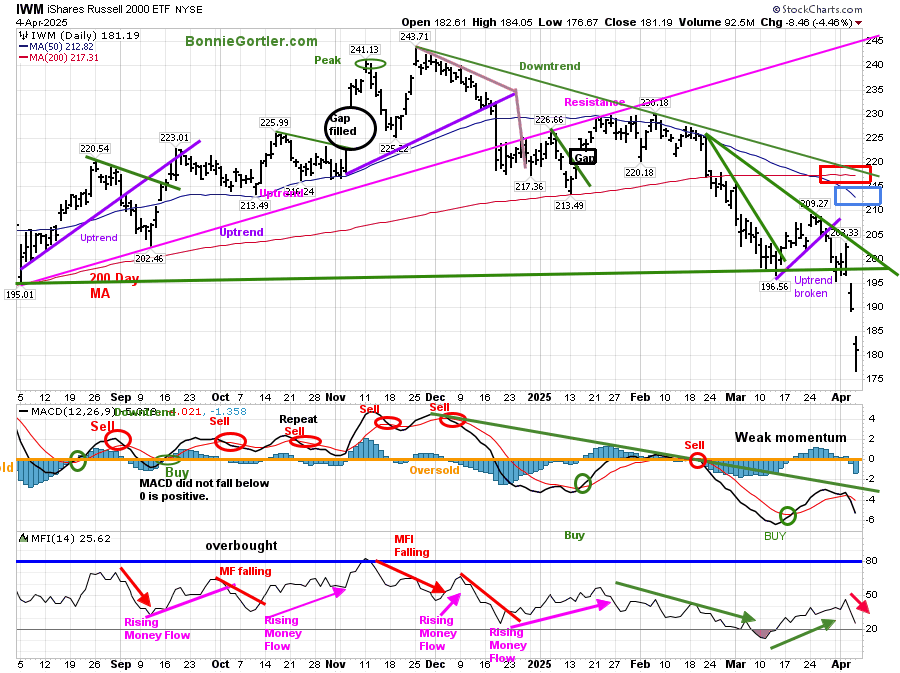
Figure 7: Daily iShares Russell 2000 (IWM) Price (Top) and 12-26-9 MACD (Bottom)
040425 IWM Daily
Source: Stockcharts.com
The iShares Russell 2000 Index ETF (IWM) downtrend since November 2024 (green line) is still in effect.
IWM fell 9.61% last week and continues to be below the 50-day (blue rectangle) and 200-day MA (red rectangle), implying weakness. In March, IWM broke the February downtrend (green line) but was short-lived, failing to get above the 50- or 200-day Moving Average. Last week, IWM continued lower after breaking the short-term March uptrend the previous week.
MACD (lower chart) remains on a buy below 0, accelerating lower again with falling money flow (lower chart).
A short-term rally could occur if MACD breaks the downside momentum downtrend (green line) from November 2024 and IWM closes first above 205.00 and then above 220.00 for two days. There is no sign of a bottom, and risk remains of further decline.
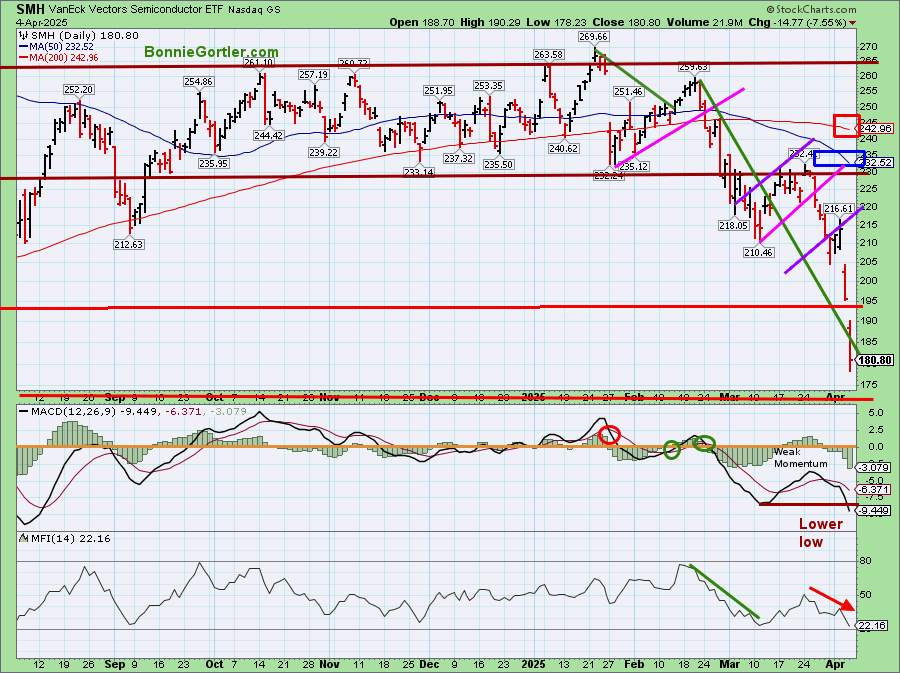
Figure 8: Daily Semiconductors (SMH) (Top) and 12-26-9 MACD (Middle) and Money Flow (Bottom)
040425 SMH Daily
Source: Stockcharts.com
The top chart shows the Daily Semiconductors (SMH) ETF, concentrated mainly in US-based Mega-Cap Semiconductor companies. SMH tends to be a leading indicator for the market when investors are willing to take on increased risk, and the opposite is true when the market is falling.
SMH remained weak, breaking support at 220.00 the previous week. Selling pressure continued breaking below 210.00 and 200.00 support, closing near its low on Friday at 180.80, down -14.79% for the week, remaining below the 50 (blue rectangle) and 200-day MA (red rectangle), a sign of underlying weakness.
Support broke at 210.00, followed by 200.00. Resistance is at 195.00, 205.00, 220.00, and 230.00.
MACD, a measure of momentum (middle chart), generated a sell after making a lower low in momentum. Money flow (lower chart) continues lower.
There is no sign of a bottom in Semiconductors at this time.
Sum Up:
The Dow, S&P 500, and Nasdaq were clobbered after higher-than-expected tariffs were announced and investors dumped stocks. The major averages and stocks remain below key moving averages as price and momentum have accelerated lower. A short-term bounce is possible to alleviate the short-term oversold conditions. Expect day-to-day volatility until the market stabilizes in the short term. Risk remains high, with New Lows above 150 on the New York Stock Exchange Index, momentum patterns declining both short and intermediate term, and uncertainty regarding tariffs. There is no sign of a bottom yet. Manage your risk, and your wealth will grow.
If you want to explore the charts further and get to know each other better, email me at Bonnie@BonnieGortler.com, or you can go directly to my calendar to schedule a time Here.
If you like this market update, you will love my free Charting Master Class. Learn more HERE.


Create more wealth in your life
with these simple strategies.
As an added bonus you will also
receive BG’s Updates and Ezine

Discover how to quickly create more well-being in your life with these simple strategies.
As an added bonus you will also
receive BG’s Updates and Ezine

As an added bonus you will receive BG’s Updates and Ezine

All work listed on BonnieGortler.com is licensed under a Creative Commons Attribution - Noncommercial - No Derivative Works 3.0 Unported License.
