

Bonnie’s Market Update 4/4/25
04/06/2025
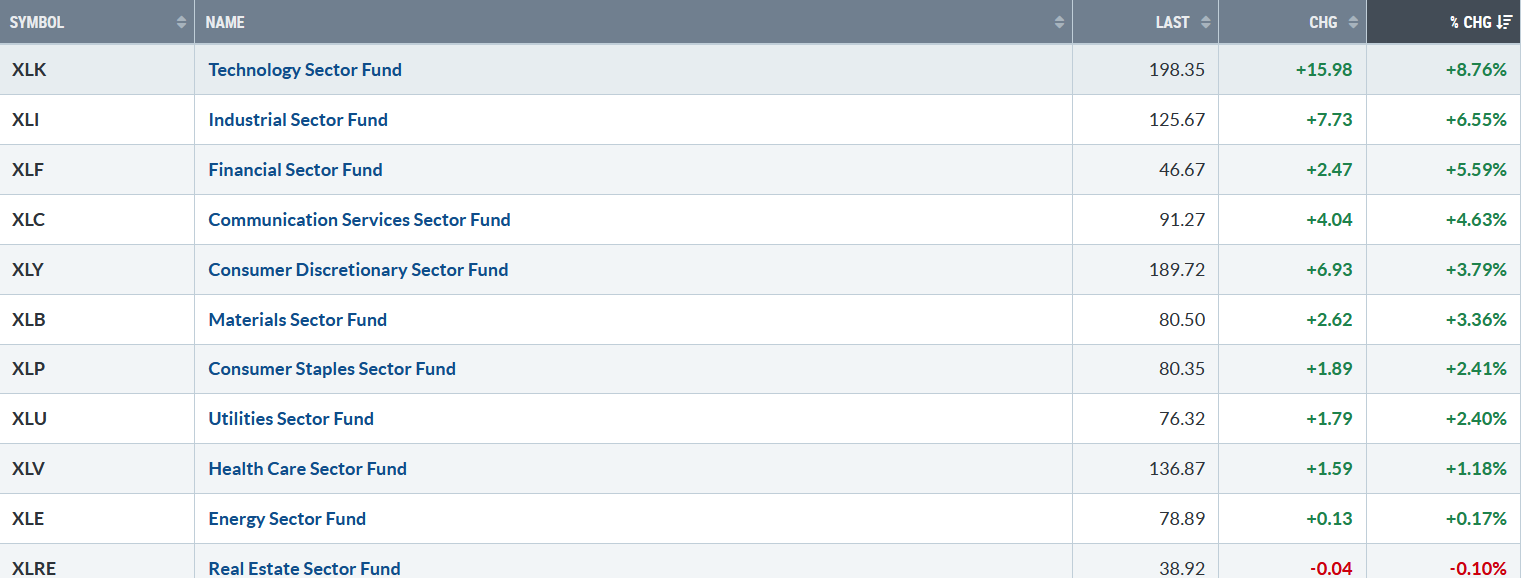
The volatility continues. Ten of eleven S&P SPDR sectors were higher last week. Technology (XLK) and Industrials (XLI) were the strongest sectors, while Energy XLE) and Real Estate (XLRE) were the weakest sectors. The SPDR S&P 500 ETF Trust (SPY) rose +5.67%.
S&P SPDR Sector ETFs Performance Summary 4/04/25 – 4/11/25
041125 weekly SPDR Sectors
Source: Stockcharts.com
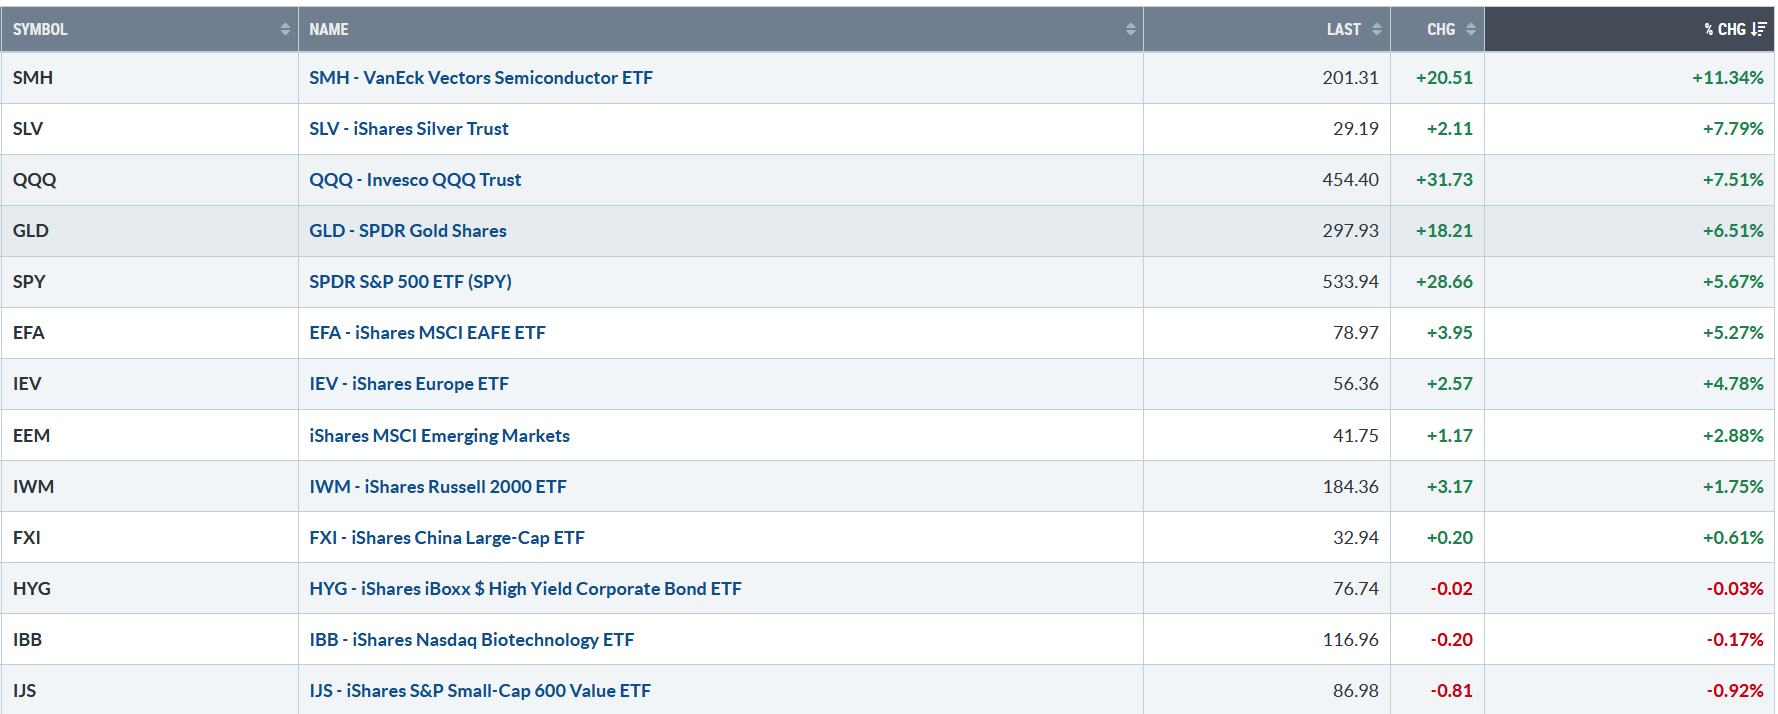
Figure 2: Bonnie’s ETFs Watch List Performance Summary 4/04/25 – 4/11/25
041125 Bonnie’s ETF Watch L
Source: Stockcharts.com
A broad rally. Semiconductors, Technology, Silver, and Gold led the market higher outperforming the S&P 500. Small Cap Growth and Value continue to underperform.
CHARTS CHARTS AND MORE CHARTS FOR YOU TO REVIEW. GO HERE.
Figure 3: Fear & Greed Index
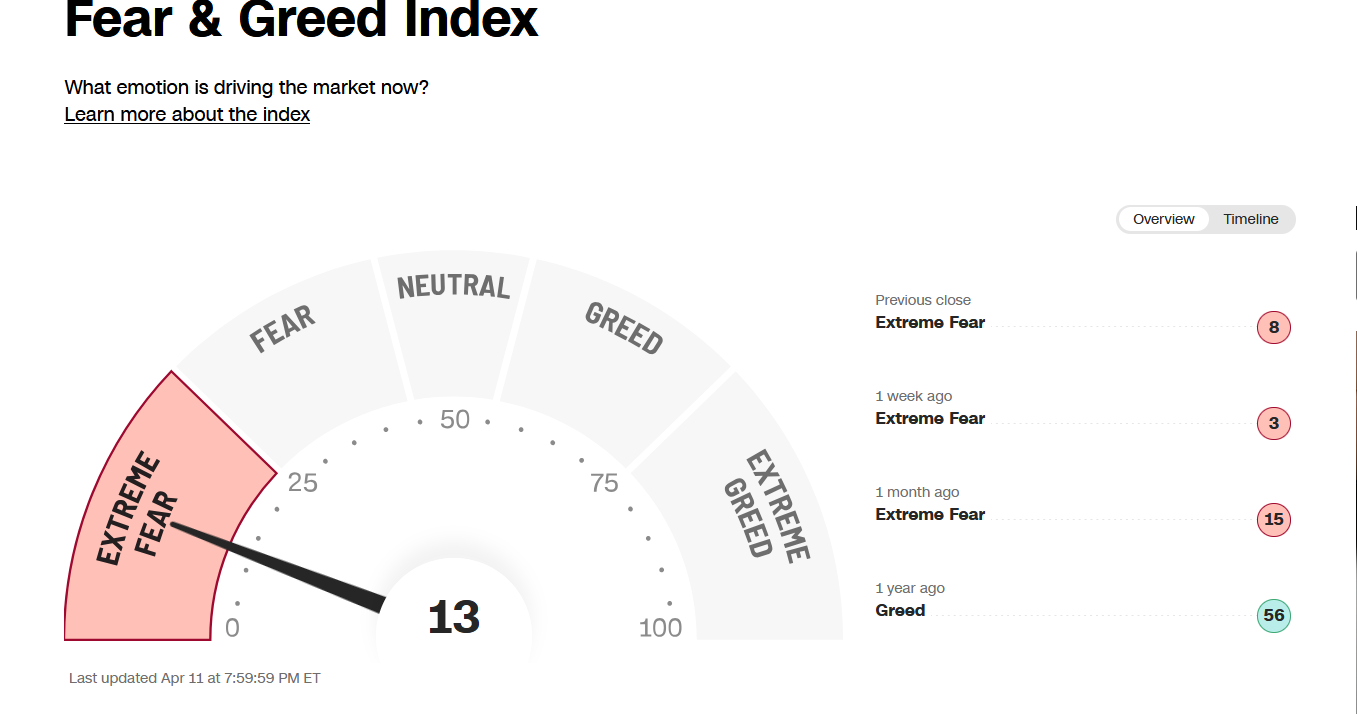
Source. CNN.com
Investor sentiment, measured by the Fear and Greed Index (a contrarian index), upticked to 13 from 4, a low reading, remaining in the extreme fear zone, where good buying opportunities arise.
Figure 4: UST 10YR Bond Yields Daily
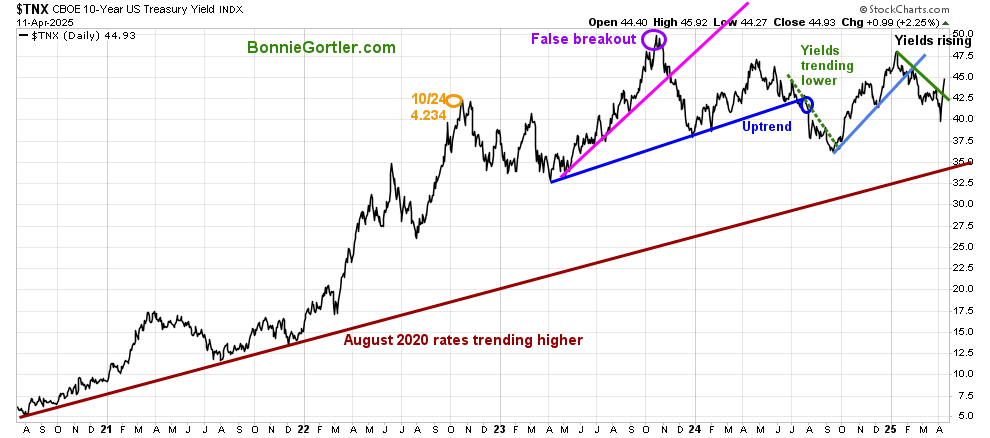
041125 UST 10 Yr Bond Yie
The 10-year U.S. Treasury yields rose last week, closing Friday at 4.493%, the highest since February. The bond market is volatile. Support is 4.00%, and resistance remains at 4.75%.
I invite you to join my Facebook Group. Learn more about it here: Wealth Through Market Charts.
NYSE New Lows Contract but not yet in low-risk zone
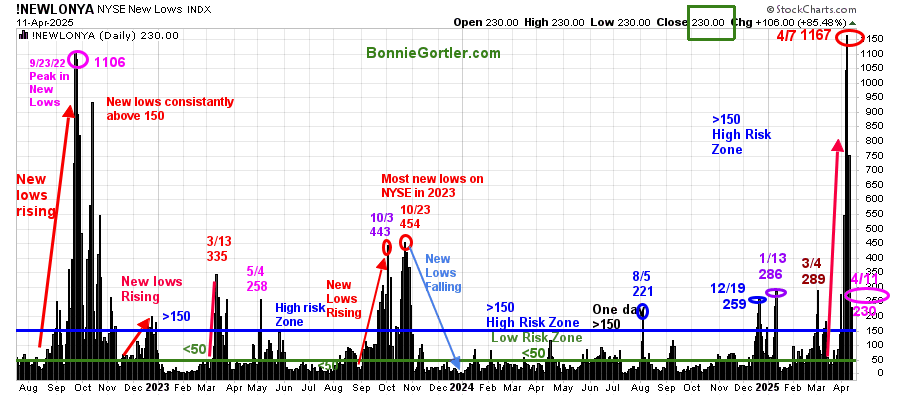
Figure 5: NYSE New Lows
041125 NYSE New Lows
Source: Stockcharts.com
New Lows on the NYSE rose in December 2024, with a high of 259. They briefly contracted before peaking at 286 (purple circle) on 1/13/25. New lows in early 2025 have hit high risk a few times and then contracted.
New Lows peaked at 1167 on 4/7. New Lows closed at 230, remaining above 150 in the high-risk zone. Watch New Lows to see if New Lows stay above 150, implying an increased risk of further downside, or if they start to contract and fall below 150, which would be a positive sign in the short term.
Learn more about the significance of New Lows in my book, Journey to Wealth, published on Amazon. If you would like a preview, get a free chapter here.
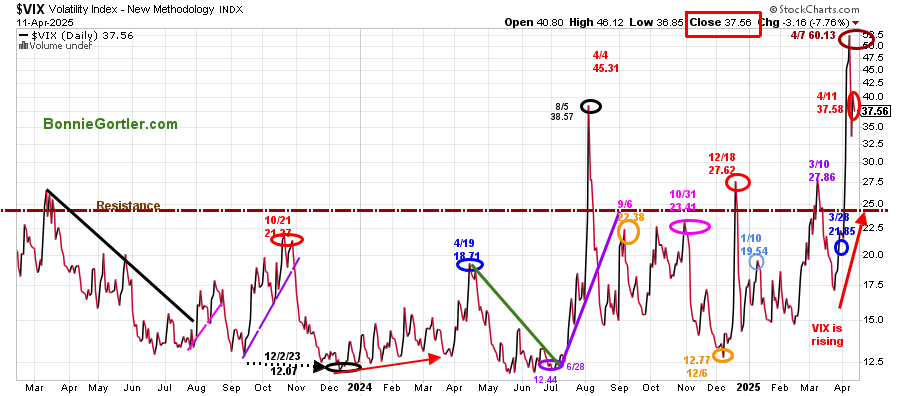
Figure 6: CBOE Volatility Index (VIX)
041125 VIX Daily
Source: Stockcharts.com
The CBOE Volatility Index (VIX), a measure of fear, rose to 60.13 on 4/7, then retreated, falling to close at 37.58 (red circle). Expect intraday volatility to continue high.
The S&P 500 intermediate trend remains down.
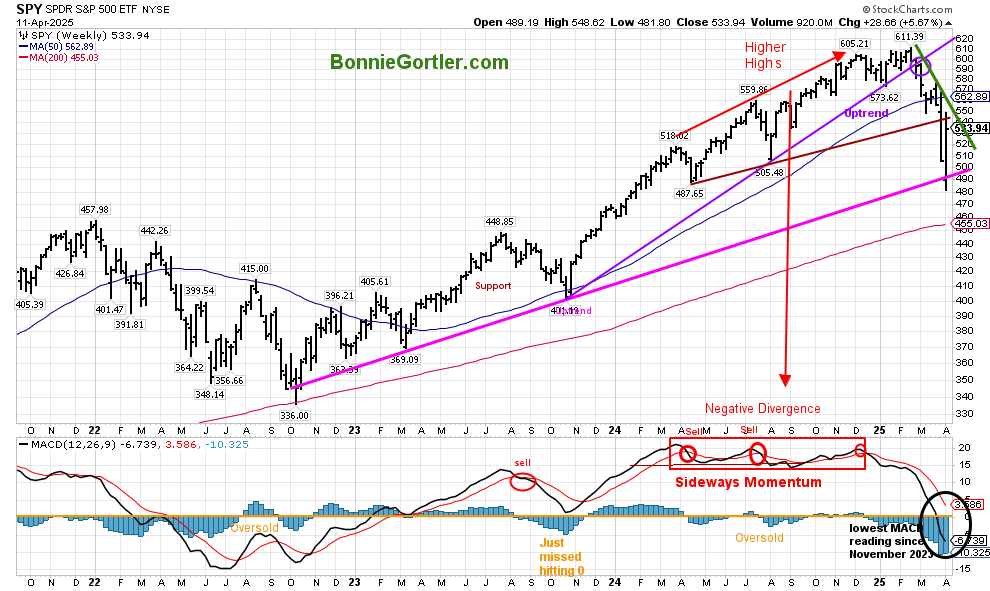
Figure 7: S&P 500 Weekly (SPY)
041125 Weekly SPY
Source: Stockcharts.com
The S&P 500 (SPY) top chart remains in an intermediate downtrend. Last week, SPY traded below 490.00, the 2022 uptrend line. However, buyers stepped in, and the SPY closed above, which is positive. On the other hand, if last week’s rally fails and the SPY closes below 481.80, it would likely trip the sell stops and imply further downside toward 455.00.
Despite the rise in the SPY, MACD (bottom chart) made a new intermediate momentum low for the year and the lowest since 2022. Currently, no low-risk buying pattern has developed for the intermediate term. You want to see a slowing in downside momentum, a turn-up, and MACD get above 0 for an intermediate sustainable rally.
Learn how to implement a powerful wealth-building mindset and charting strategies to help you grow your wealth in the comfort of your home in my eCourse Wealth Through Investing Made Simple. Learn more here.
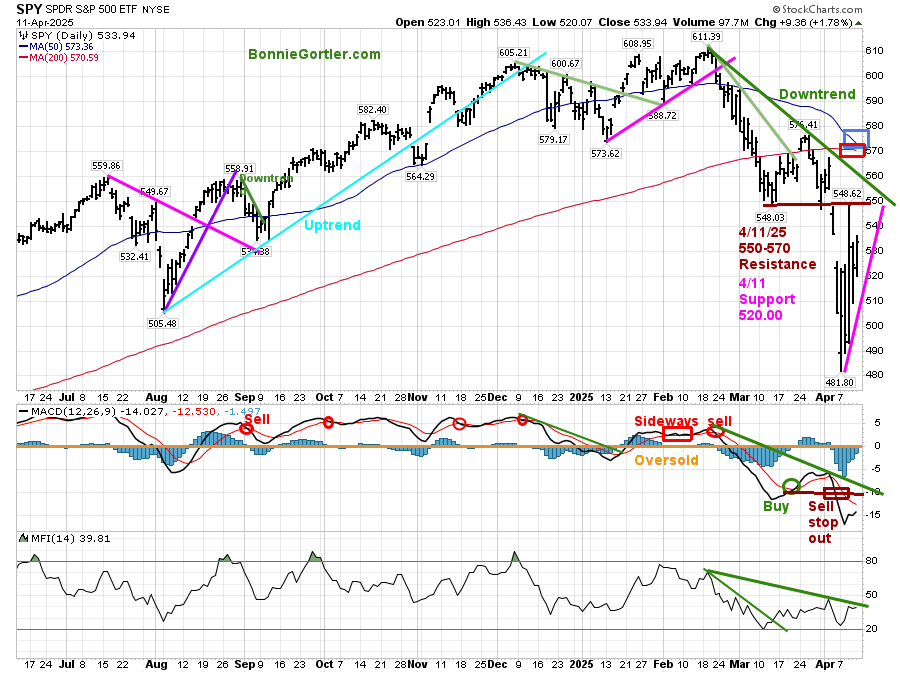
Figure 8: S&P 500 Daily (SPY)
041125 SPY Daily
Source: Stockcharts.com
The S&P 500 (SPY) rose last week by 5.67%, but the short term remains down.
Resistance is between 550.00 and 570.00. Support is at 520.00.
MACD is on a sell after making a lower low in momentum but turned up late last week, a positive sign. Further gains in the SPY would likely generate a MACD buy, and it would be more convincing if MACD breaks the February downtrend in momentum.
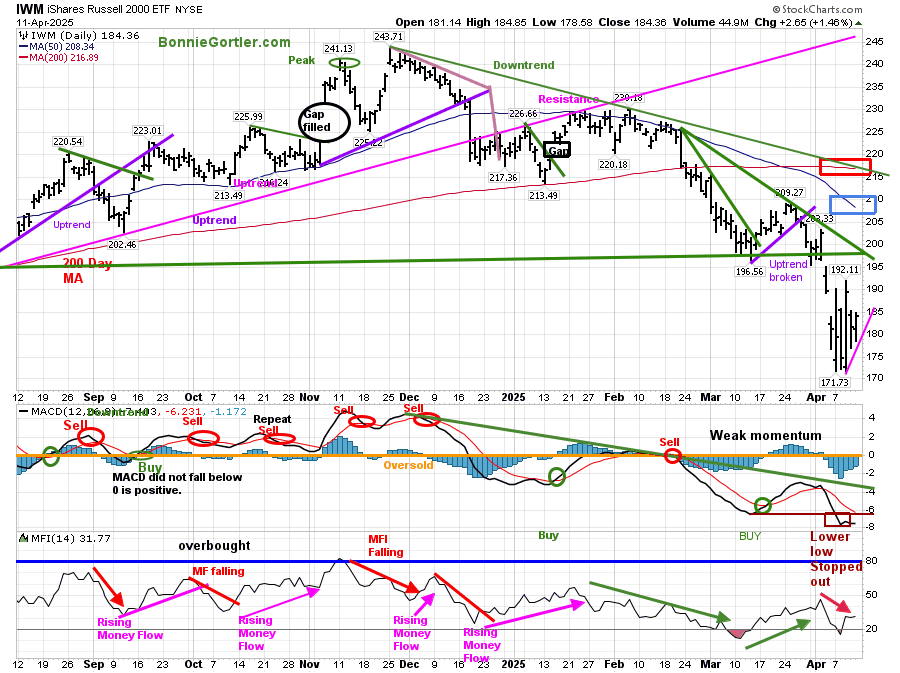
Figure 9: Daily iShares Russell 2000 (IWM) Price (Top) and 12-26-9 MACD (Bottom)
041125 IWM Daily
Source: Stockcharts.com
The iShares Russell 2000 Index ETF (IWM) downtrend since November 2024 (green line) is still in effect and close well below the 50-day (blue rectangle) and 200-day MA (red rectangle).
IWM rose +1.75% last week, underperforming the S&P 500 yet again. Resistance is 192.00, 197.00, and 208.00. Support is 178.00 and 170.00.
MACD (lower chart) is on a sell ( a lower low in MACD, below 0, starting to flatten, which is positive for the short term.
Money Flow (lower chart) has stopped falling, a positive sign, but there is no significant buying yet.
A short-term rally could start if MACD breaks the downside momentum downtrend (green line) from November 2024 and IWM closes above 192.00 resistance for 2 days.
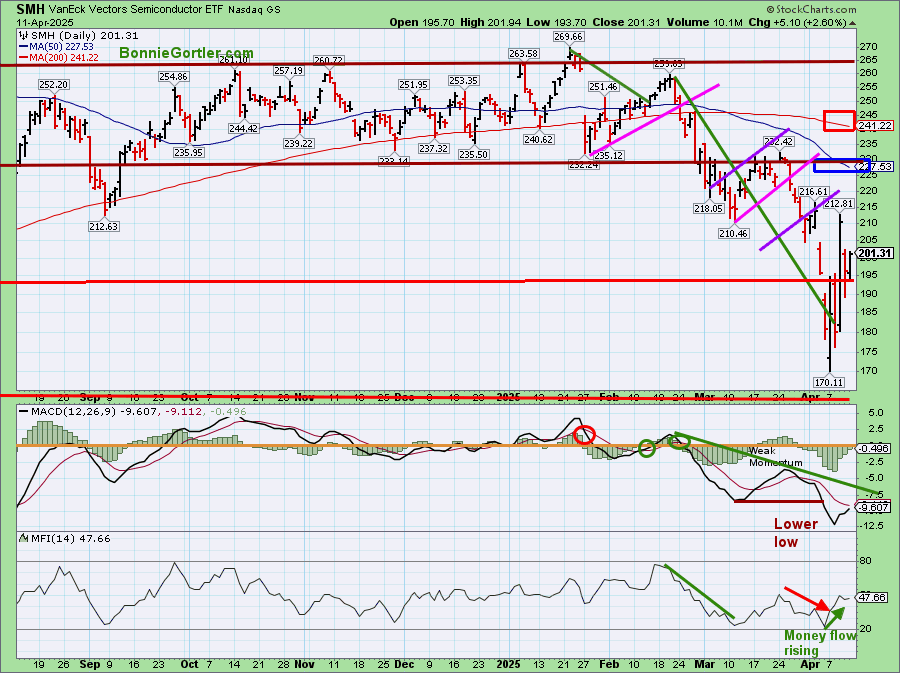
Figure 10: Daily Semiconductors (SMH) (Top) and 12-26-9 MACD (Middle) and Money Flow (Bottom)
041125 SMH Daily
Source: Stockcharts.com
The top chart shows the Daily Semiconductors (SMH) ETF, concentrated mainly in US-based Mega-Cap Semiconductor companies. SMH tends to be a leading indicator for the market when investors are willing to take on increased risk, and the opposite is true when the market is falling.
SMH led the market higher, up +11.34% the week, but it remains below the 50 (blue rectangle) and 200-day MA (red rectangle).
Support is 193.00, 180.00, and 170.00. Resistance is at 205.00, 220.00, and 230.00.
MACD, a measure of momentum (middle chart), is on a sell after making a low in momentum but close to generating a buy.
Money flow (lower chart) is rising, a positive in the short term.
Sum Up:
Day-to-day volatility continued last week. The major averages and stocks remain below key moving averages. Daily momentum patterns after accelerating lower have improved. Intermediate momentum patterns imply more time for the bottoming process to develop and a lower-risk bottom. A short-term bounce in technology stocks, which would support the broad market, will likely start the week after news of President Trump exempts phones, computers, and chips from new tariffs. Expect day-to-day volatility until the market stabilizes in the short term and investors become more comfortable with the uncertainty that lies ahead. Manage your risk, and your wealth will grow.
If you want to explore the charts further and get to know each other better, email me at Bonnie@BonnieGortler.com, or you can go directly to my calendar to schedule a time Here.
If you like this market update, you will love my free Charting Master Class. Learn more HERE.


Create more wealth in your life
with these simple strategies.
As an added bonus you will also
receive BG’s Updates and Ezine

Discover how to quickly create more well-being in your life with these simple strategies.
As an added bonus you will also
receive BG’s Updates and Ezine

As an added bonus you will receive BG’s Updates and Ezine

All work listed on BonnieGortler.com is licensed under a Creative Commons Attribution - Noncommercial - No Derivative Works 3.0 Unported License.
