

Shift from Stress to Strength: Simple Wealth Strategies
04/01/2025
Volatility continued, and sellers were in control until Friday, when the buyers stepped in. Ten of the eleven S&P SPDR sectors were lower last week. Healthcare (XLV) eked out a small gain, the best sector, while Consumer Discretionary (XLY) and the Financial (XLF) sectors were the weakest. The SPDR S&P 500 ETF Trust (SPY) fell -3.07%.
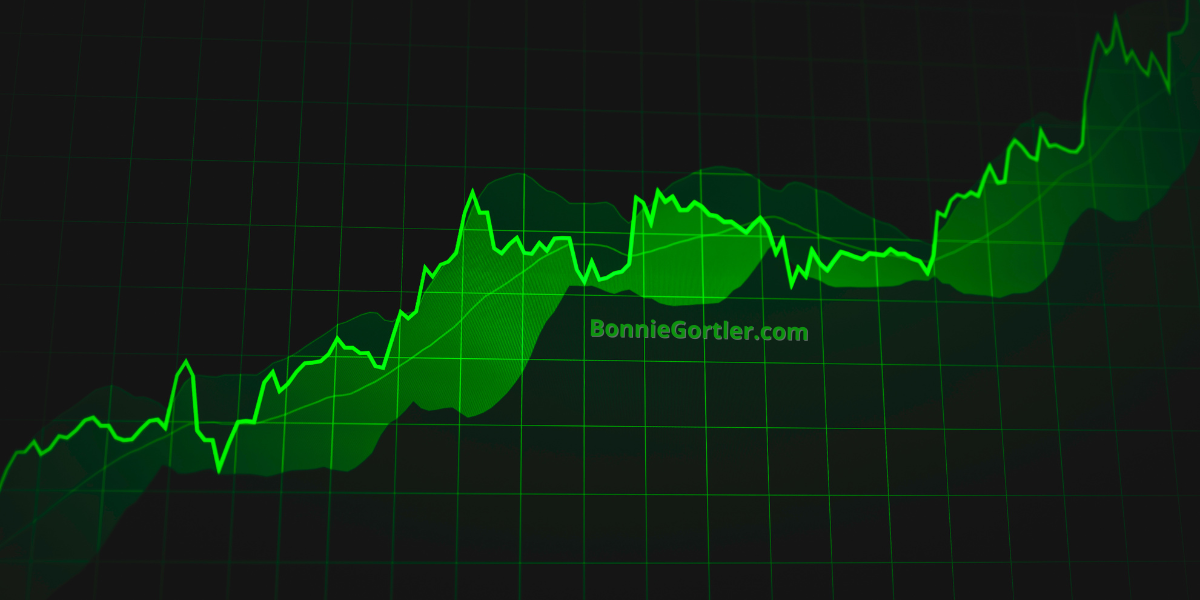
S&P SPDR Sector ETFs Performance Summary 2/28/25 – 3/7/25
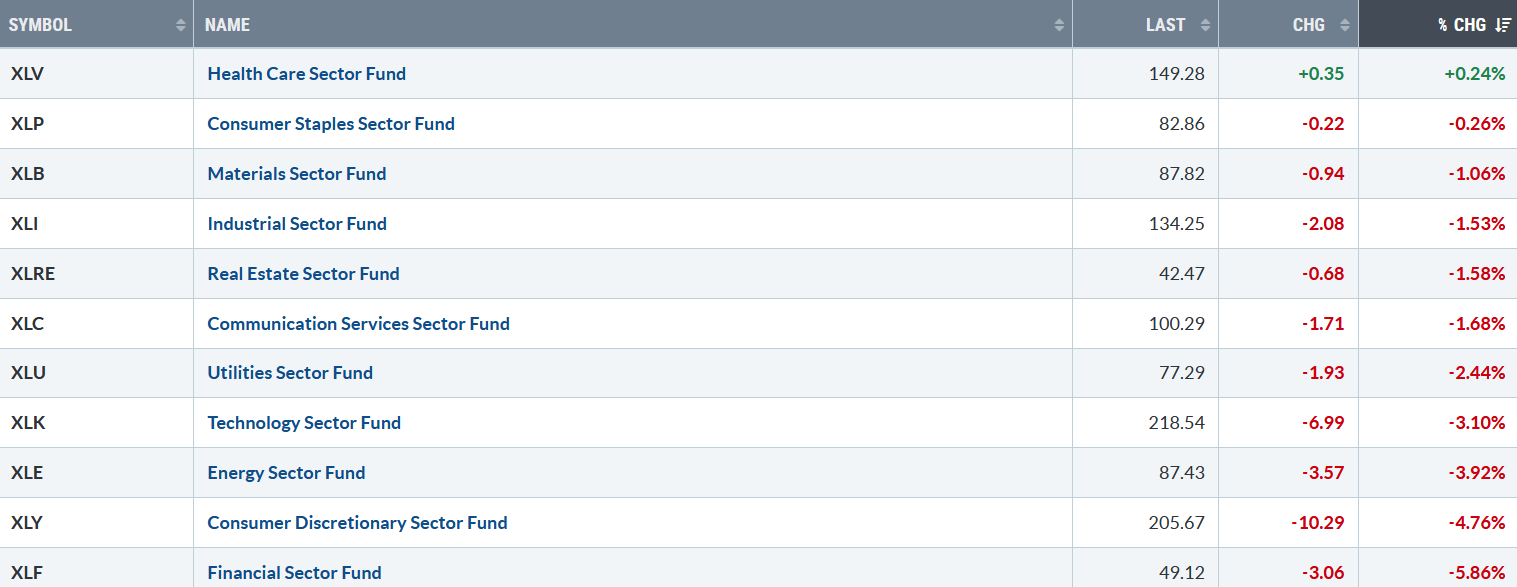
030725 SPDR Sectors
Source: Stockcharts.com
Figure 2: Bonnie’s ETFs Watch List Performance Summary 2/28/25 – 3/7/25
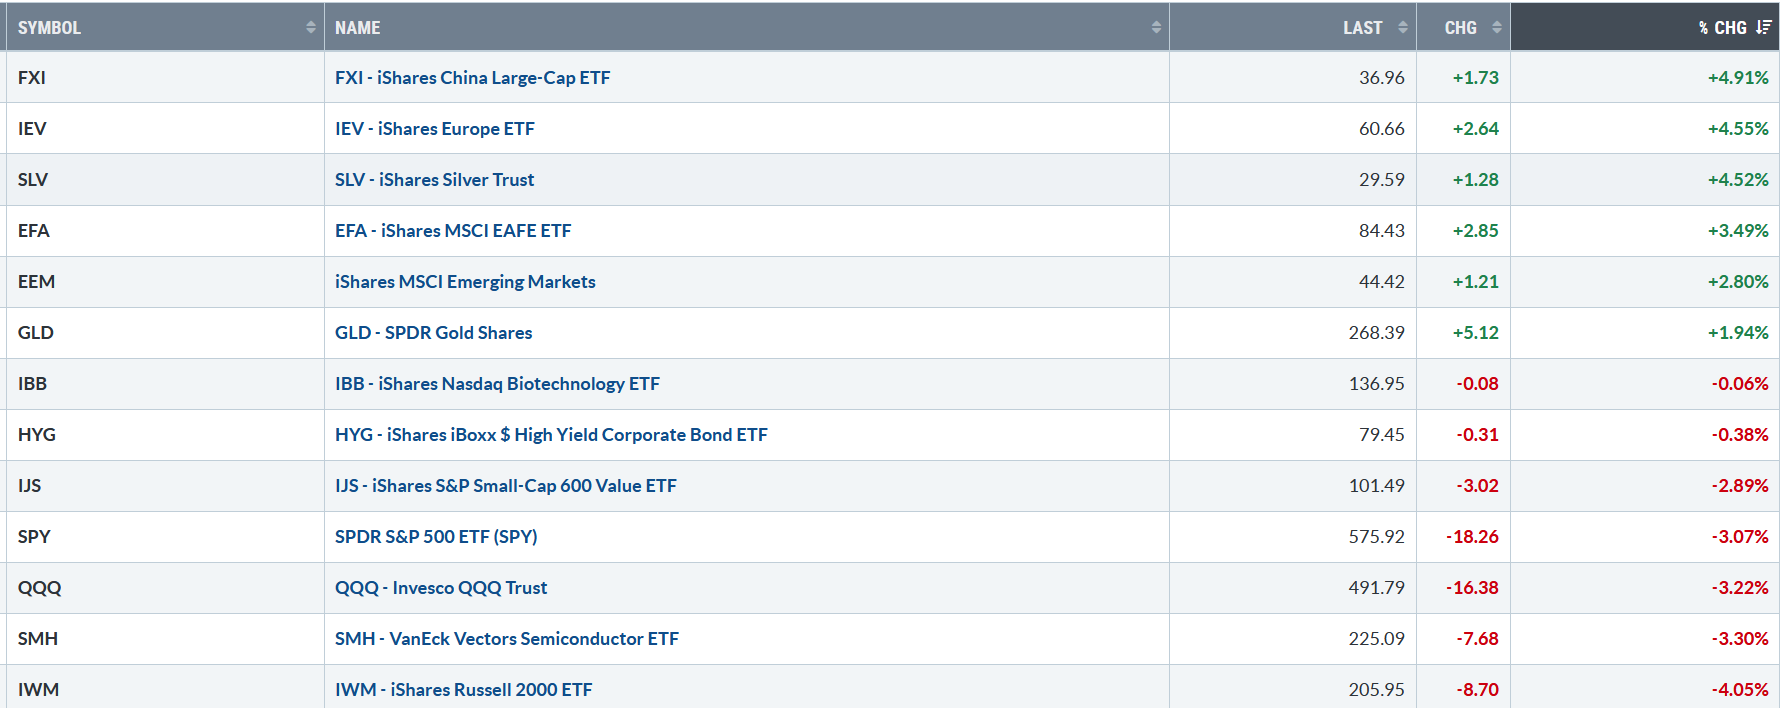
030725 Bonnie’s ETF Watch
Source: Stockcharts.com
The dollar weakened last week, helping the international markets outperform U.S. markets. Gold and Silver showed good gains. Small-caps, both large and small, large-cap technology, and Semiconductors were under heavy selling pressure.
Figure 3: Fear & Greed Index
Source. CNN.com
Investor sentiment, measured by the Fear and Greed Index (a contrarian index), stayed the same from a week ago, closing at 20 and remaining in the extreme fear zone, often where good buying opportunities arise.
Figure 4: NYSE New Lows
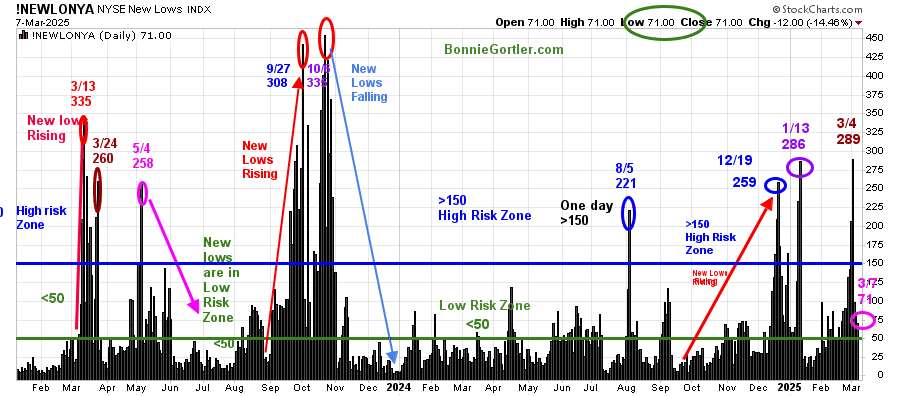
030725 NYSE New Lows
Source: Stockcharts.com
New Lows on the NYSE rose in December 2024, with a high of 259. They briefly contracted before peaking at 286 (purple circle) on 1/13/25 and then contracted.
New lows have risen since 2025. Last week, they were above 150, implying increased risk in the market. However, they quickly contracted and closed Friday, 3/7, at 71 (pink circle), no longer in the high-risk zone. Watch New Lows to see if New Lows expand above 150, implying an increased risk of the downtrend continuing or remaining below 100, and then contract between 25 and 50, which would be positive for the short term.
Learn more about the significance of New Lows in my book, Journey to Wealth, published on Amazon. If you would like a preview, get a free chapter here.

Figure 5: Daily iShares Russell 2000 (IWM) Price (Top) and 12-26-9 MACD (Bottom)
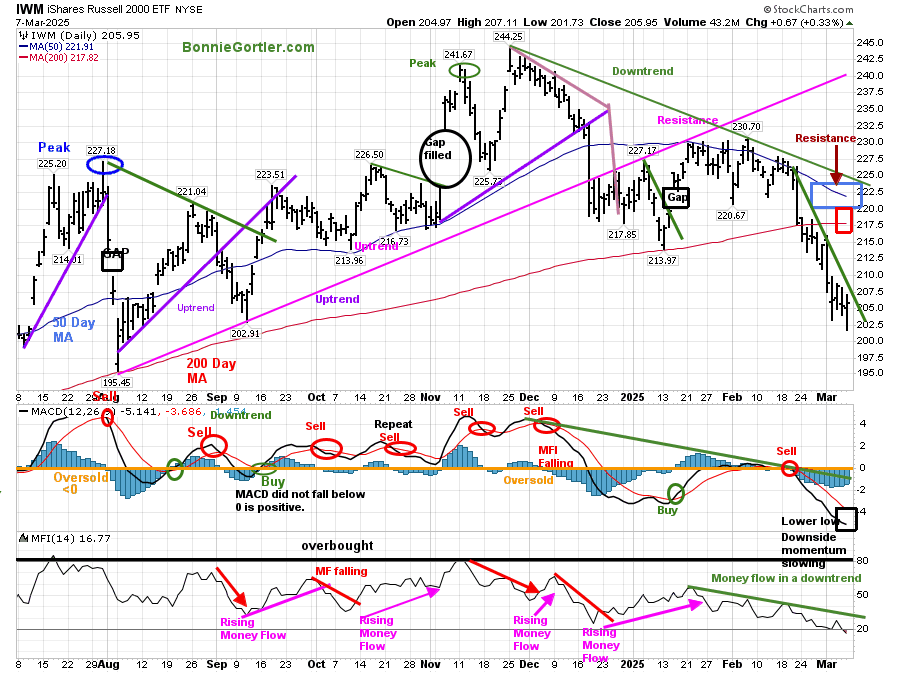
030725 IWM Daily
Source: Stockcharts.com
The iShares Russell 2000 Index ETF (IWM) fell -4.05% last week, continuing to be weaker than the S&P 500.
IWM has maintained a downtrend since December 2024 (green line). IWM continues to close below the 50-day (blue rectangle) and 200-day MA (red rectangle) out of favor of investors.
MACD remains on a sell, below 0, making a new low and still falling, but with less downside momentum. It’s too early to declare a bottom. A more sustainable rally is likely if it can turn up, generate a buy, and break the downtrend (green line) from January 2025.
For now, two closes above 210 breaking the downtrend would be a positive sign, implying the decline is likely over, and a reflex rally could begin.
Money Flow (lower chart) remains in a downtrend, oversold below 20 but not yet implying investors’ buying interest.
Sum Up:
Selling pressure in technology and semiconductor stocks and the underperformance of small-cap stocks continue to lead the market lower. The major averages remain in a downtrend after having their worst week of the year. The short-term momentum oscillators remain oversold and continue to make new lows on slowing downside momentum, but it’s too early to say a bottom has occurred. A sharp reflex rally could happen at any time, but first, watch for price downtrends to break and patterns of higher lows to form. Manage your risk, and your wealth will grow.
If you want to go deeper into the charts and get to know each other better, email me at Bonnie@BonnieGortler.com, or if you prefer, you can go directly to my calendar to schedule a time Here.
If you like this market update, you will love my free Charting Master Class. Learn more HERE.


Create more wealth in your life
with these simple strategies.
As an added bonus you will also
receive BG’s Updates and Ezine

Discover how to quickly create more well-being in your life with these simple strategies.
As an added bonus you will also
receive BG’s Updates and Ezine

As an added bonus you will receive BG’s Updates and Ezine

All work listed on BonnieGortler.com is licensed under a Creative Commons Attribution - Noncommercial - No Derivative Works 3.0 Unported License.
