


Bonnie’s Market Update 4/11/25
04/13/2025
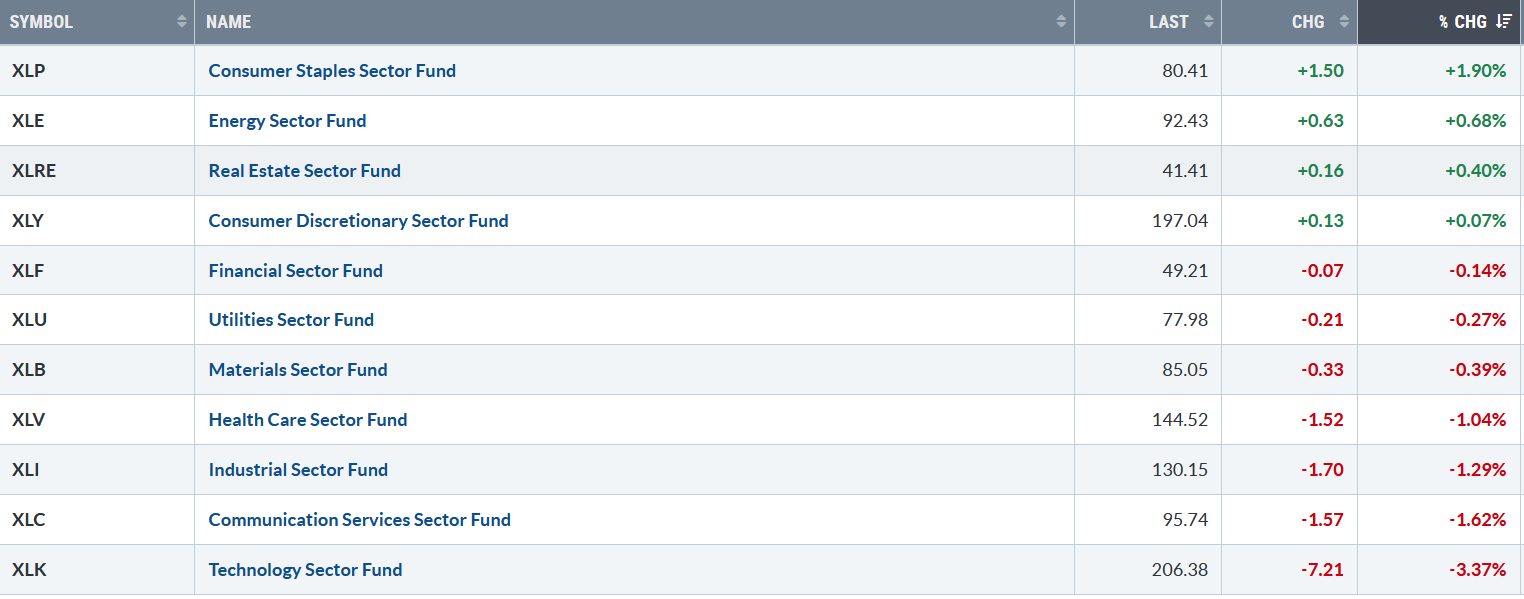
Daily volatility continued. Only four of the eleven S&P SPDR sectors were higher last week. Consumer Staples (XLP) and Energy (XLE) were the strongest, while Communication Services (XLC) and Technology (XLK) were the weakest sectors. The SPDR S&P 500 ETF Trust (SPY) fell -2.01%.
S&P SPDR Sector ETFs Performance Summary 3/21/25 – 3/28/25
032825 weekly SPDR Sectors
Source: Stockcharts.com
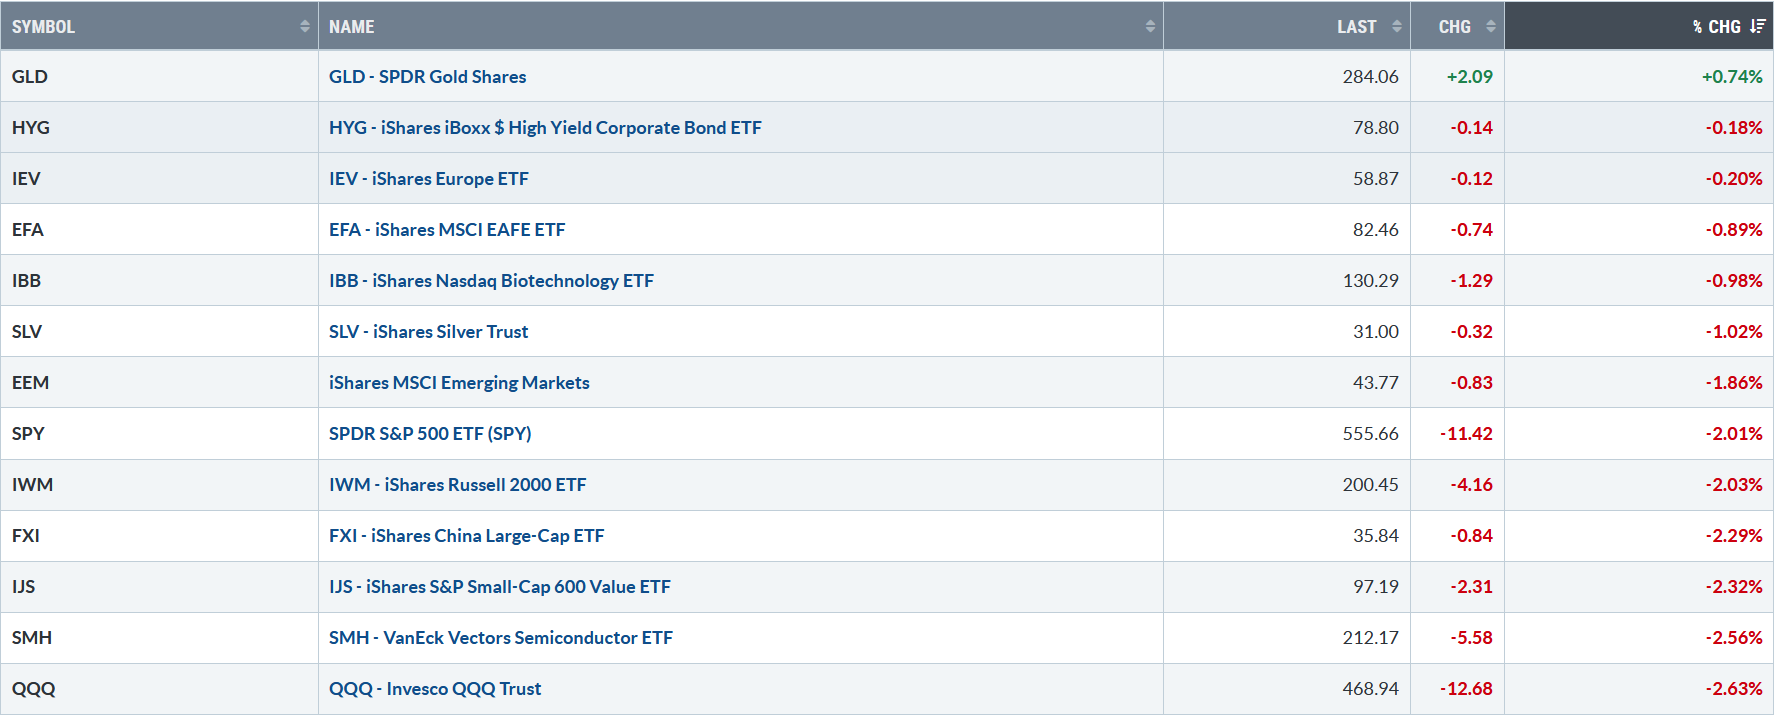
Figure 2: Bonnie’s ETFs Watch List Performance Summary 3/21/25 – 3/28/25
032825 Bonnie’s ETF Watch List
Source: Stockcharts.com
Gold continued its winning ways. Semiconductors, Technology, Small-Cap Growth, and Value remained under selling pressure.
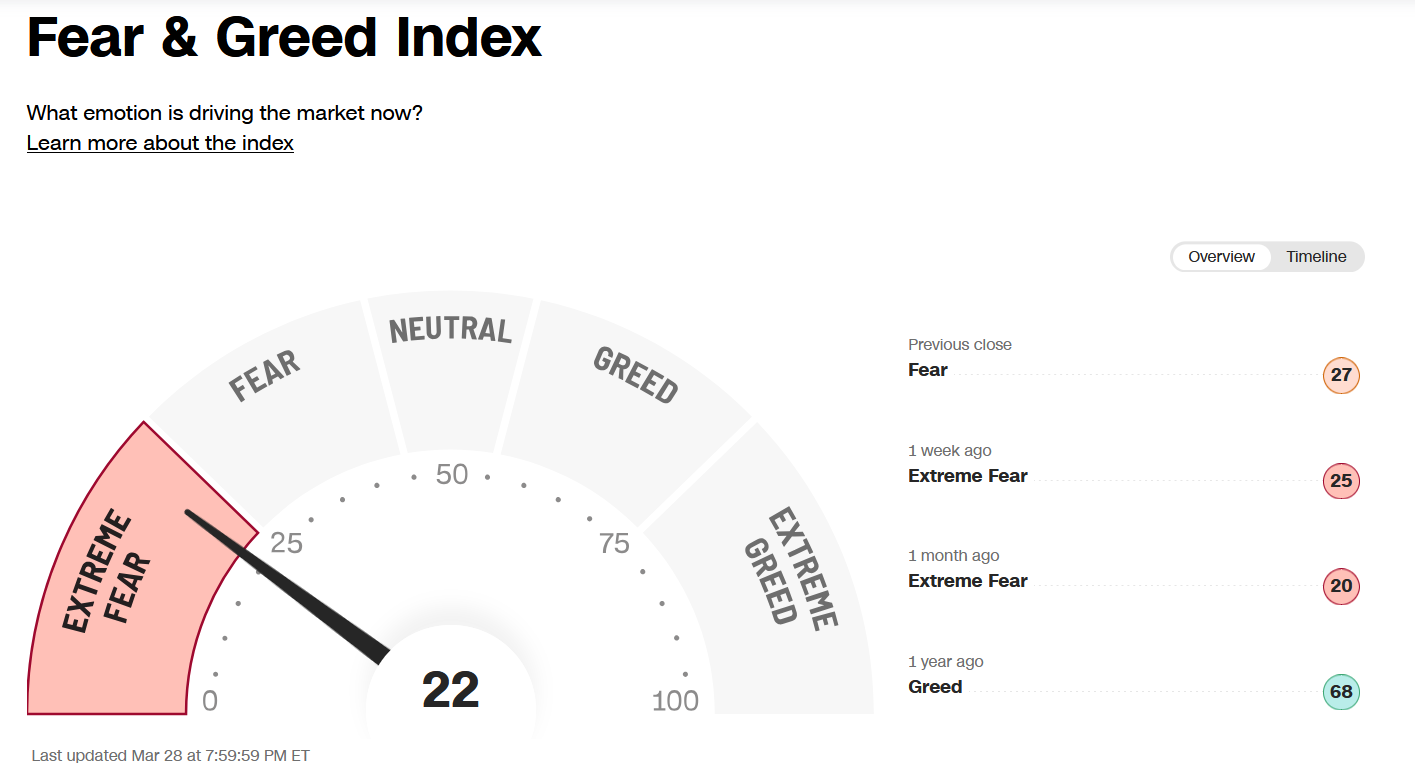
Figure 3: Fear & Greed Index
032825 CNN Fear and Greed Index
Source. CNN.com
Investor sentiment, measured by the Fear and Greed Index (a contrarian index), closed at 22, remaining in the extreme fear zone, often where good buying opportunities arise, but not yet as rally attempts have stalled quickly.
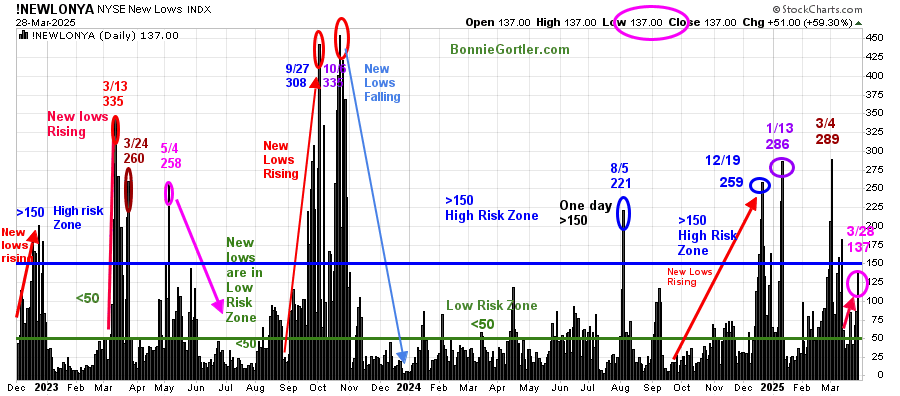
Figure 4: NYSE New Lows
032825 NYSE New Low
Source: Stockcharts.com
New Lows on the NYSE rose in December 2024, with a high of 259. They briefly contracted before peaking at 286 (purple circle) on 1/13/25 and then contracted.
New lows in 2025 have hit high risk a few times and then contracted. Last week, New Lows closed, 3/21, increasing again to 137 (pink circle), just under the high-risk zone. Watch New Lows to see if New Lows expand above 150, implying an increased risk of the downtrend accelerating or falling below 100 and contracting between 25 and 50, which would be positive for the short term.
Learn more about the significance of New Lows in my book, Journey to Wealth, published on Amazon. If you would like a preview, get a free chapter here.
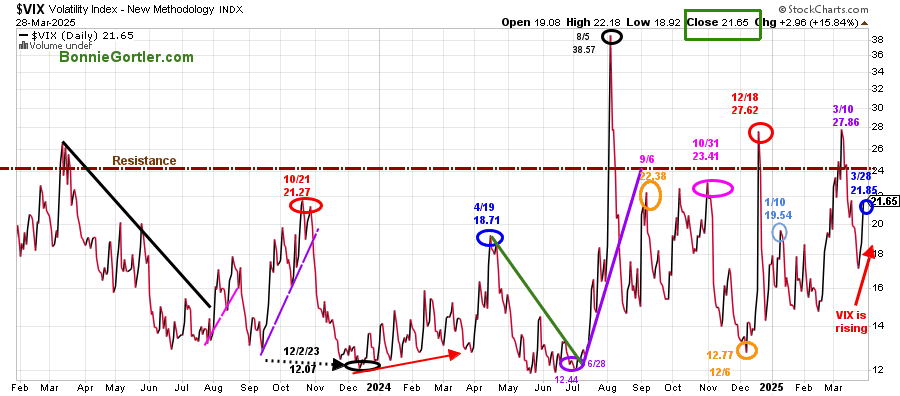
Figure 5: CBOE Volatility Index (VIX)
032825 VIX Daily
Source: Stockcharts.com
The CBOE Volatility Index (VIX), a measure of fear, stopped falling last week and is now rising, closing at 21.65 (blue circle), implying increased intraday volatility and risk.
Source: Stockcharts.com
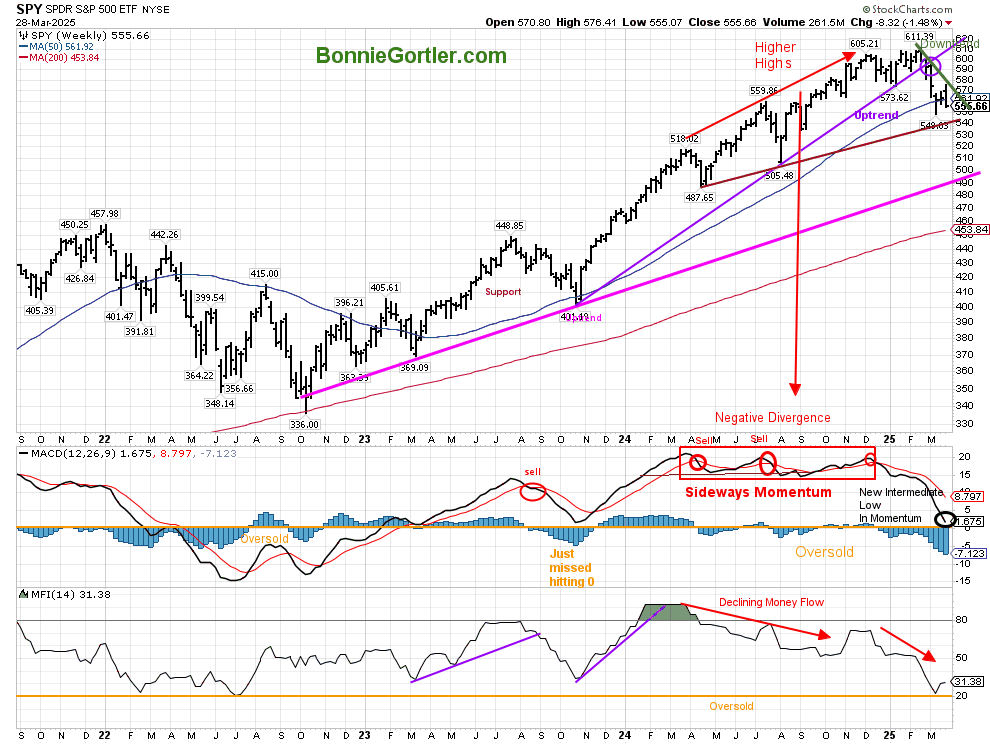
Figure 6: S&P 500 Weekly (SPY)
032825 SPY Weekly
Source: Stockcharts.com
The S&P 500 SPY (top chart) remains in an intermediate downtrend.
MACD (middle chart) is falling, not quite oversold, below 0. MACD has made a new momentum low for the year, implying more time is necessary for an intermediate bottom.
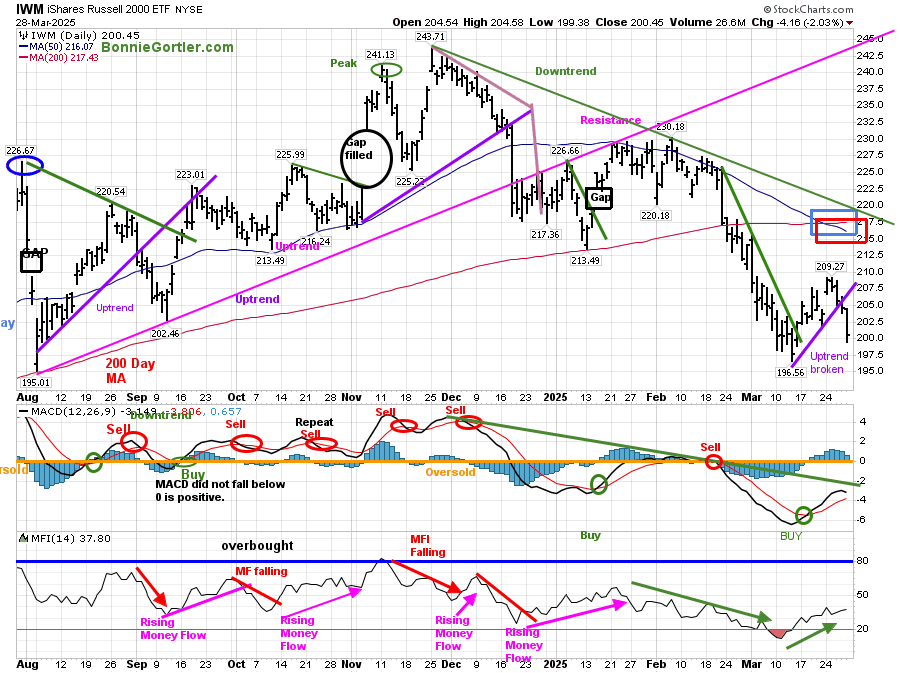
Figure 7: Daily iShares Russell 2000 (IWM) Price (Top) and 12-26-9 MACD (Bottom)
032825 IWM Daily
Source: Stockcharts.com
The iShares Russell 2000 Index ETF (IWM) downtrend since November 2024 (green line) is still in effect.
IWM fell -1.54% last week and continues to be below the 50-day (blue rectangle) and 200-day MA (red rectangle), implying weakness. In March, IWM broke the February downtrend (green line) but was short-lived, failing to get above the 50- or 200-day Moving Average.
Last week, IWM broke the short-term March uptrend, which is negative, but IWM did not take out the low, implying a potential bottom can still occur. On the other hand, two closes below the low would be negative and imply more weakness and potentially accelerating decline.
MACD (lower chart) is on a buy below 0. It’s encouraging that MACD downside momentum has subsided, and the money flow (lower chart) is trending higher (green line). However, its negative IWM is below the 50 and 200-day MA, and the March uptrend broke last week. A more sustainable rally could occur if MACD breaks the momentum downtrend (green line) from November 2024 and IWM closes first above 210.00 and then above 220.00 for two days.
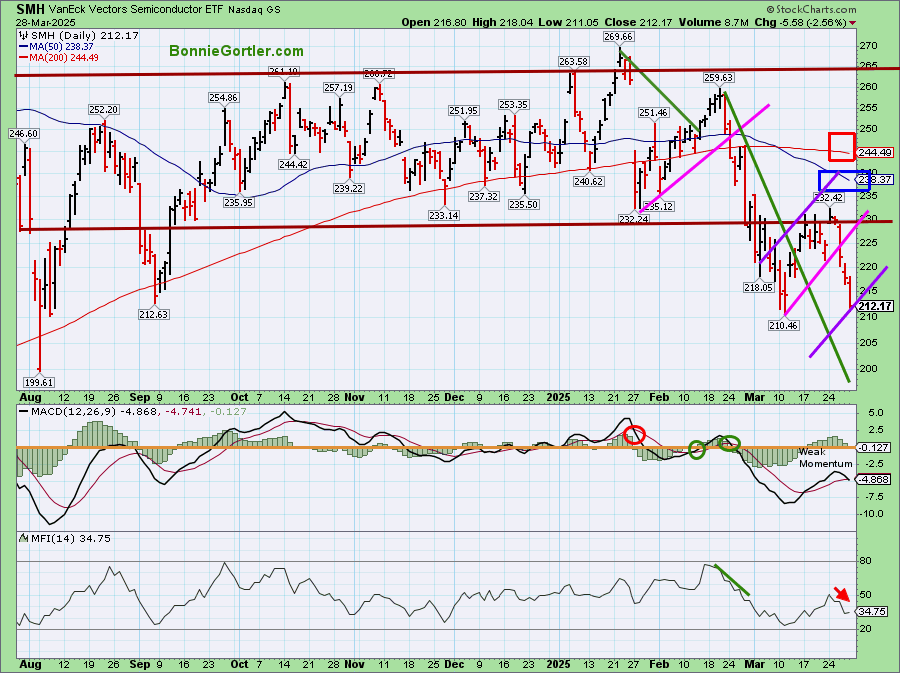
Figure 8: Daily Semiconductors (SMH) (Top) and 12-26-9 MACD (Middle) and Money Flow (Bottom)
032825 SMH Daily
Source: Stockcharts.com
The top chart shows the Daily Semiconductors (SMH) ETF, concentrated mainly in US-based Mega-Cap Semiconductor companies. SMH tends to be a leading indicator for the market when investors are willing to take on increased risk, and the opposite is true when the market is falling.
SMH remains weak, breaking support at 220.00 and leading the market lower. It closed near its low at 212.17, down -5.61% for the week and below the 50 (blue rectangle) and 200-day MA (red rectangle), a sign of underlying weakness.
Support is at 210.00, followed by 200.00. Resistance at 223.00, 231.00, 241.00, and 246.00.
MACD, a measure of momentum (middle chart), remains on a buy with weak momentum, implying weakness to continue. No sell is possible unless a lower low in MACD occurs. Money Flow (lower chart) has turned down. It would be positive if MACD turned up and formed a double bottom and was strong enough to get above 0.
Sum Up:
The Dow, S&P 500, and Nasdaq were lower but closed above the March lows as the bottoming process continued. Uncertainty regarding tariffs, interest rates, and inflation is not helping investor confidence. Intermediate momentum patterns are falling and are not yet in a favorable position. Short-term momentum patterns have turned up but to no avail. The major averages and stocks remain below key moving averages, with overhead resistance above. The risk of the decline accelerating exists unless buyers step in quickly, holding the March lows for a short-term bottom to occur. Manage your risk, and your wealth will grow.
If you want to explore the charts further and get to know each other better, email me at Bonie@BonnieGortler.com, or you can go directly to my calendar to schedule a time Here.
If you like this market update, you will love my free Charting Master Class. Learn more HERE.


Create more wealth in your life
with these simple strategies.
As an added bonus you will also
receive BG’s Updates and Ezine

Discover how to quickly create more well-being in your life with these simple strategies.
As an added bonus you will also
receive BG’s Updates and Ezine

As an added bonus you will receive BG’s Updates and Ezine

All work listed on BonnieGortler.com is licensed under a Creative Commons Attribution - Noncommercial - No Derivative Works 3.0 Unported License.
