

Bonnie’s Market Update 4/4/25
04/06/2025
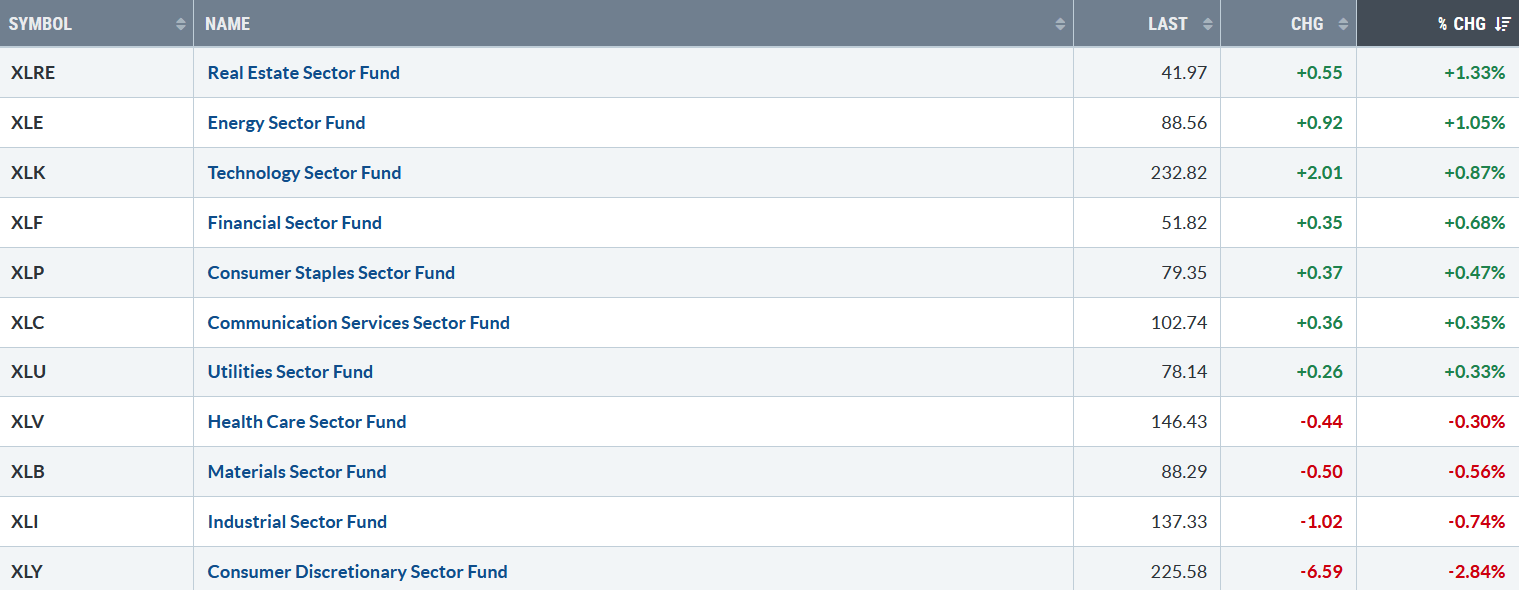
The S&P 500, Dow, and Nasdaq were all lower last week. Seven of the eleven S&P SPDR sectors were higher. Real Estate (XLRE) and Energy were the best sectors, while Industrials (XLI) and Consumer Discretionary (XLY) were the weakest. The SPDR S&P 500 ETF Trust (SPY) fell -0.17%.
S&P SPDR Sector ETFs Performance Summary 1/31/25 – 2/7/25
020725 SPDR Sectors
Source: Stockcharts.com
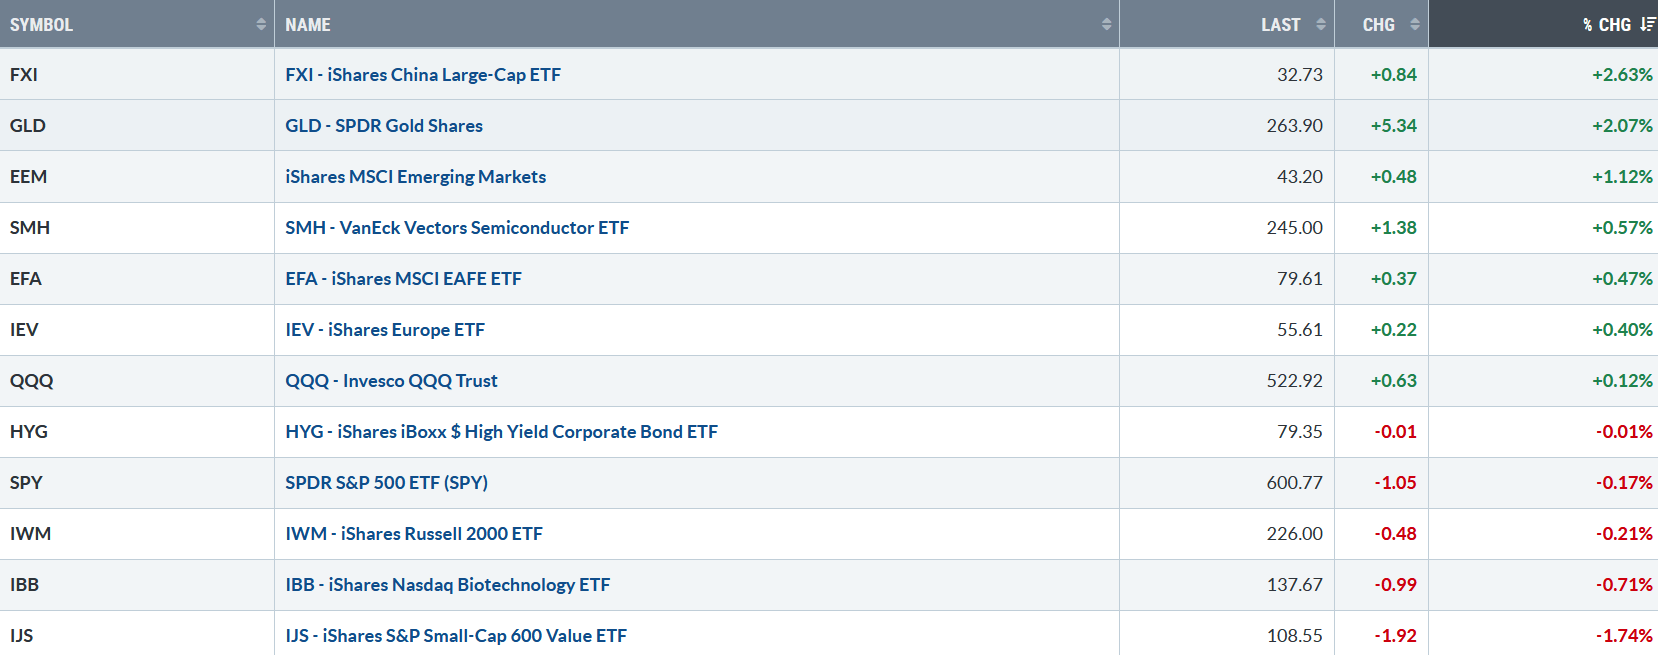
Figure 2: Bonnie’s ETFs Watch List Performance Summary 1/31/25 – 2/7/25
020725 Bonnie’s ETF Watch List
Source: Stockcharts.com
China and Gold led. Global markets are performing better and could strengthen further if the dollar weakens.
You can explore this week’s market charts and more HERE.
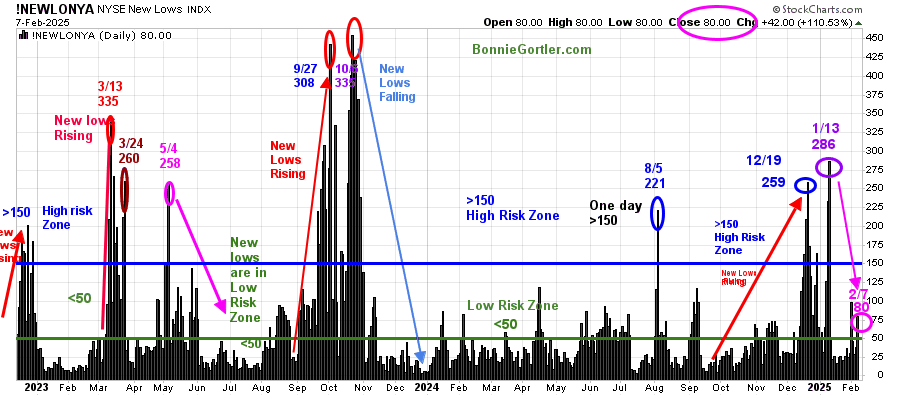
Figure 3: NYSE New Lows
020725 NYSE New Lows
Source: Stockcharts.com
New Lows on the NYSE rose in December 2024, with a high of 259, then briefly contracted before peaking at 286 (purple circle) on 1/13/25, and then fallen into a low-risk zone for the last few weeks.
Friday, New lows closed at 80 (pink circle). Continue to watch New Lows to see if New Lows will begin to expand above 150, a sign of increased risk weakness ahead.
Learn more about the significance of New Lows in my book, Journey to Wealth, published on Amazon. If you would like a preview, get a free chapter here.
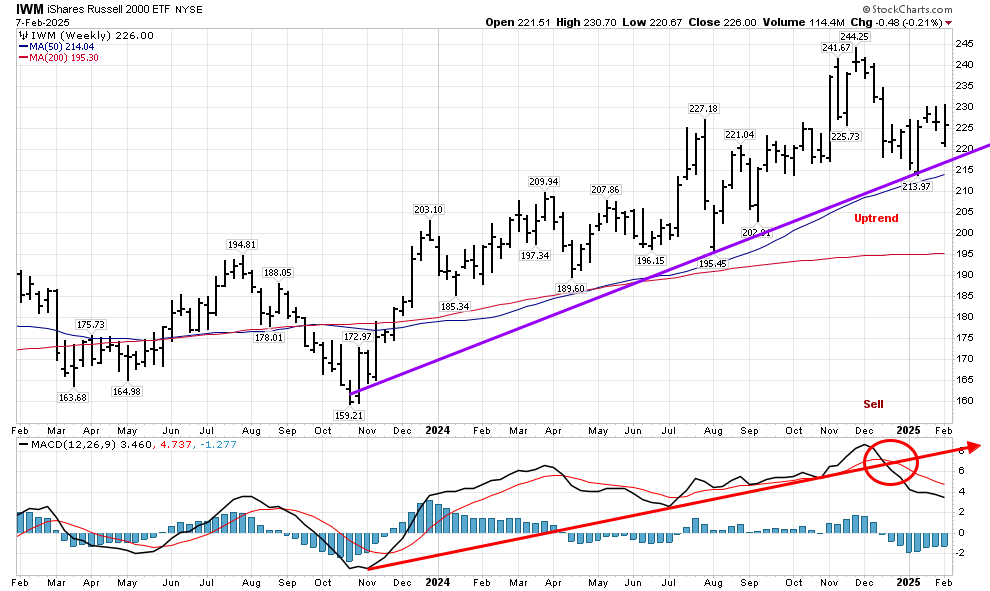
Figure 4: Weekly iShares Russell 2000 (IWM) Price (Top) and 12-26-9 MACD (Bottom)
020725 IWM Daily
Source: Stockcharts.com
The Weekly iShares Russell 2000 Index ETF (IWM) did not experience selling pressure last week, down only -0.21%.
It’s positive that the IWM intermediate trend from November 2023 (purple line) remains intact. However, it is worrisome that the momentum uptrend from November 2023 (red line) broke, and MACD remains on a sell.
Sum Up:
Earning season continues. Intermediate momentum patterns show declining momentum, which bears watching. If selling pressure on Technology and Semiconductor stocks and the underperformance of small-cap stocks on poor market breadth, the risk of a more significant pullback increases.
If you want to discuss the charts further and get to know each other better, reply to this email, or if you prefer, you can go directly to my calendar to schedule a time. Click Here:
If you like this market update, you will love my free Charting Charting Master Class. Learn more HERE.


Create more wealth in your life
with these simple strategies.
As an added bonus you will also
receive BG’s Updates and Ezine

Discover how to quickly create more well-being in your life with these simple strategies.
As an added bonus you will also
receive BG’s Updates and Ezine

As an added bonus you will receive BG’s Updates and Ezine

All work listed on BonnieGortler.com is licensed under a Creative Commons Attribution - Noncommercial - No Derivative Works 3.0 Unported License.
