

Bonnie’s Market Update 3/28/25
03/30/2025
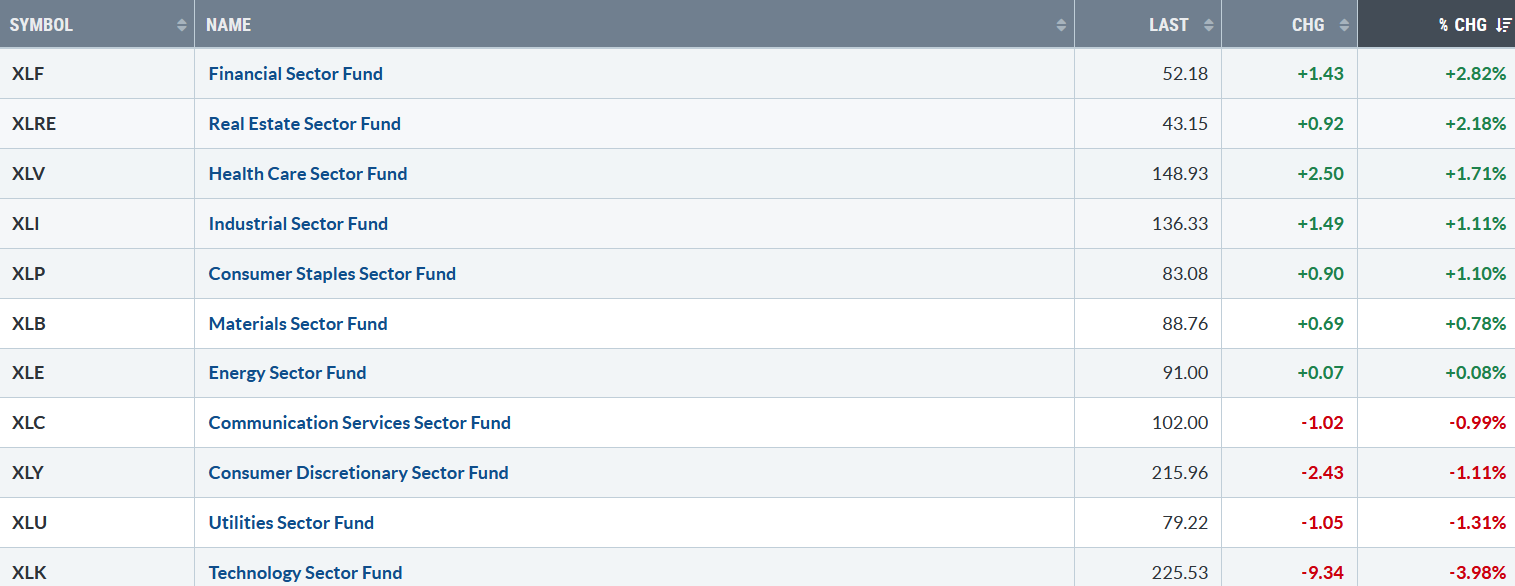
It was a volatile week that ended on a high note as buyers stepped in on the last day of February. Seven of the eleven S&P SPDR sectors were higher last week. Financial (XLF) and Real Estate (XLRE) were the best sectors, while Utilities and Technology were the weakest. The SPDR S&P 500 ETF Trust (SPY) fell -0.96%.
S&P SPDR Sector ETFs Performance Summary 2/21/25 – 2/28/25
022825 SPDR Sectors
Source: Stockcharts.com
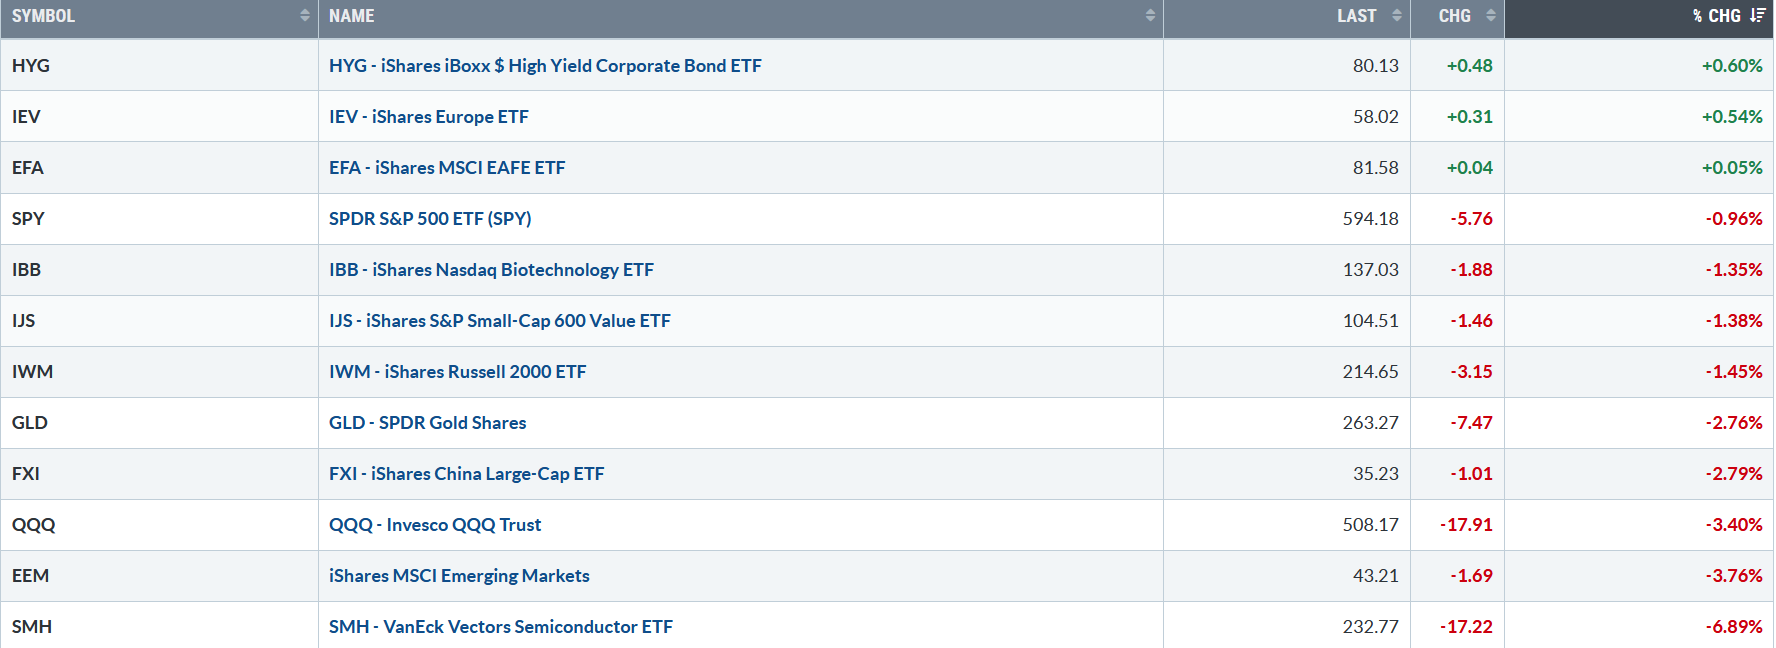
Figure 2: Bonnie’s ETFs Watch List Performance Summary 2/21/25 – 2/28/25
022825 Bonnie’s ETF Watch List
Source: Stockcharts.com
Hi Yield Corporate bonds remained firm, which is positive, although weakness in China, Small Caps, Large Cap Technology, Emerging Markets, Gold, and Semiconductors.
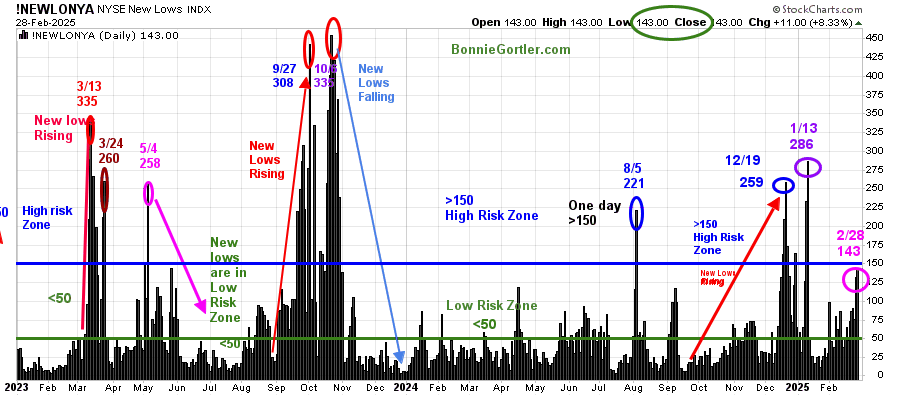
Figure 3: NYSE New Lows
 022825 NYSE New Lows
Source: Stockcharts.com
New Lows on the NYSE rose in December 2024, with a high of 259. They peaked at 286 (purple circle) on 1/13/25, and then contracted. However, new lows are rising and getting closer to implying increased risk in the market.
On Friday 2/28, New lows closed at 143 (pink circle). Continue to watch New Lows to see if New Lows expand above 150 and remain or contract and fall below 100 and then between 25 and 50.
Learn more about the significance of New Lows in my book, Journey to Wealth, published on Amazon. If you would like a preview, get a free chapter here.
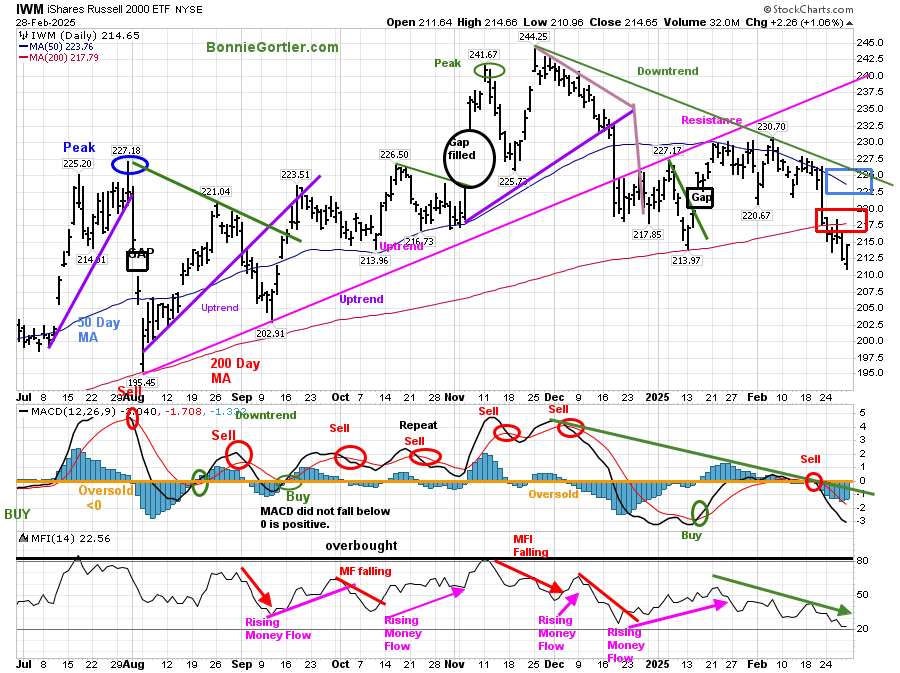
Figure 4: Daily iShares Russell 2000 (IWM) Price (Top) and 12-26-9 MACD (Bottom)
022825 IWM Daily
Source: Stockcharts.com
The iShares Russell 2000 Index ETF (IWM) fell -1.45% last week.
IWM has maintained a downtrend since December 2024 (green line). IWM closed below the 50-day (blue rectangle) and 200-day MA (red rectangle). However, it was positive that IWM closed +1.06% on Friday at its high, joining the broad market advance reversing from its low.
MACD remains on a sell, below 0, but downside momentum appears to have stopped accelerating. Time will tell if it can turn up, generate a buy, and break the downtrend (green line) from January 2025.
Money Flow (lower chart) is in a downtrend but is no longer falling and is close to oversold below 20.
Sum Up:
Selling pressure in Technology and Semiconductor stocks and the underperformance of small-cap stocks have led the market lower in February. The short-term momentum oscillators are oversold and due to turn. Pessimism has increased and is in position for a shift in sentiment. For a rally to occur, market breadth needs to improve, technology, semiconductors, and small-cap leadership vs. the S&P 500 needs to happen, or the risk of a significant pullback increases.
If you want to discuss the charts further and get to know each other better, you can visit my calendar to schedule a time. Click Here:
If you like this market update, you will love my free Charting Master Class. Learn more HERE.


Create more wealth in your life
with these simple strategies.
As an added bonus you will also
receive BG’s Updates and Ezine

Discover how to quickly create more well-being in your life with these simple strategies.
As an added bonus you will also
receive BG’s Updates and Ezine

As an added bonus you will receive BG’s Updates and Ezine

All work listed on BonnieGortler.com is licensed under a Creative Commons Attribution - Noncommercial - No Derivative Works 3.0 Unported License.
