Bonnie’s Market Update 11/15/24
Bonnie’s Market Update 11/15/24
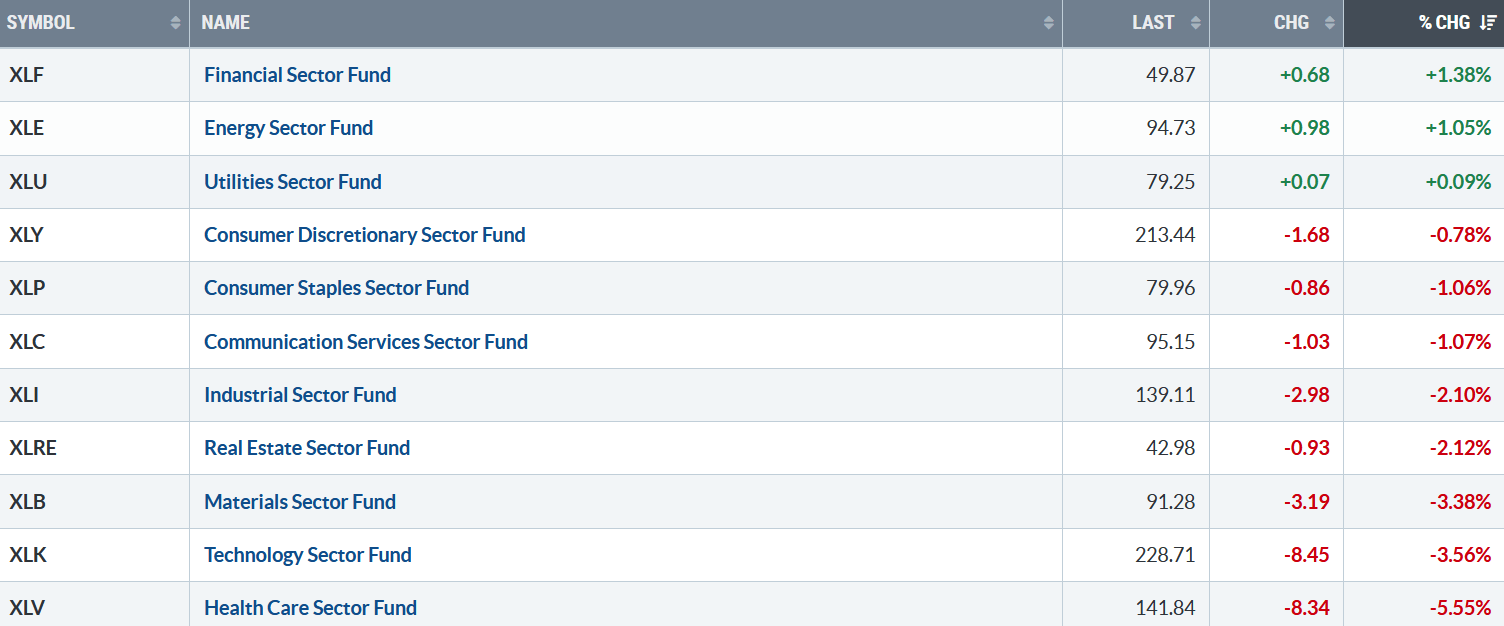
Selling predominated the action last week. Only three of the eleven S&P SPDR sectors were higher last week. Financial (XLF) and Energy were the leading Sectors, while Technology (XLK) and Healthcare (XLV) were the weakest sectors. The SPDR S&P 500 ETF Trust (SPY) fell – 2.08%.
S&P SPDR Sector ETFs Performance Summary 11/8/24 – 11/15/24
Source: Stockcharts.com
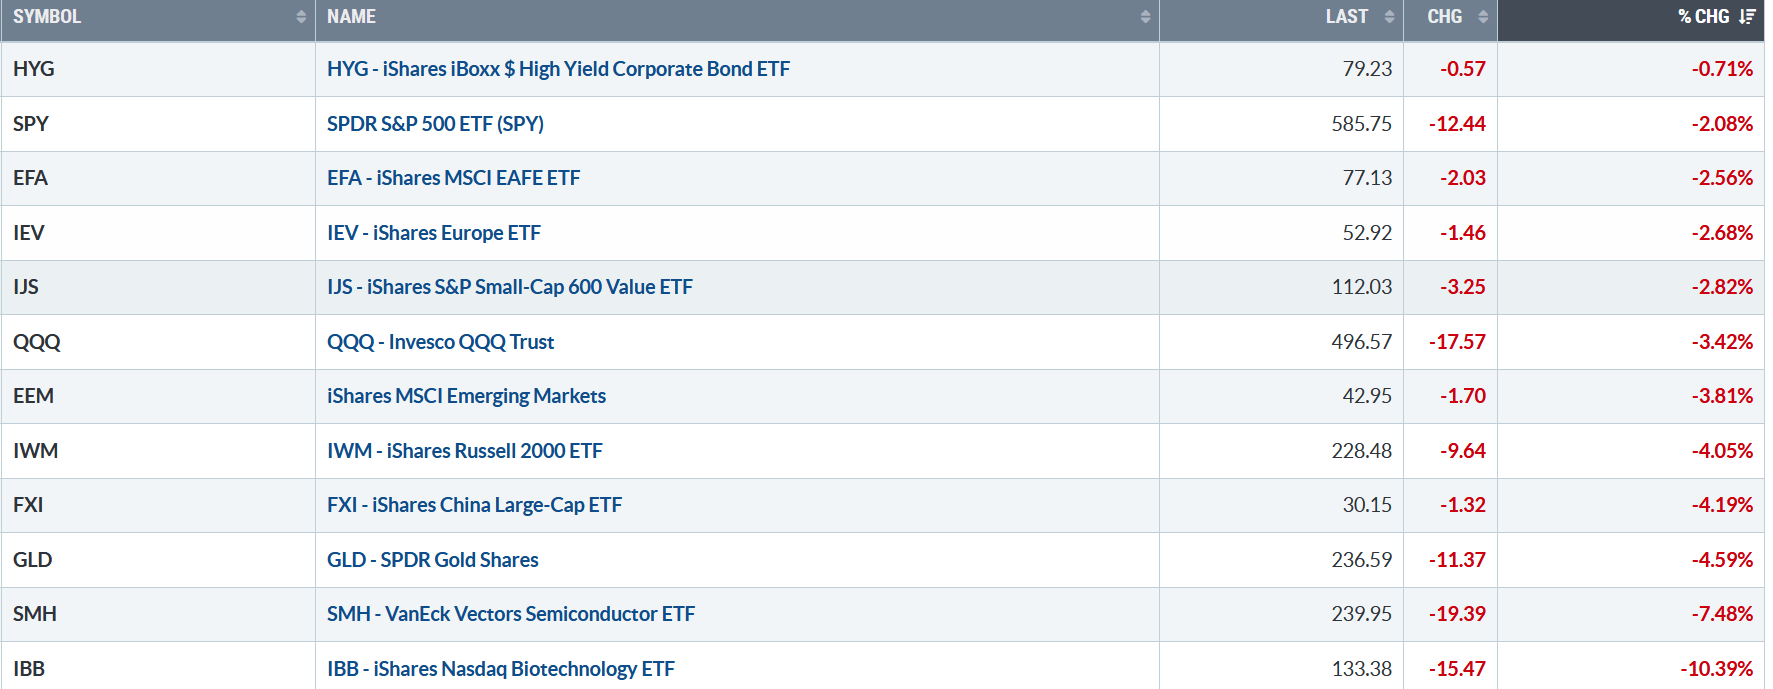
Figure 2: Bonnie’s ETFs Watch List Performance Summary 11/8/24 – 11/15/24
Source: Stockcharts.com
A broad decline last week. Gold, Semiconductors, and Biotechnology sold off sharply.
You can explore Bonnie’s market charts from last week and more HERE.
Charts to watch:
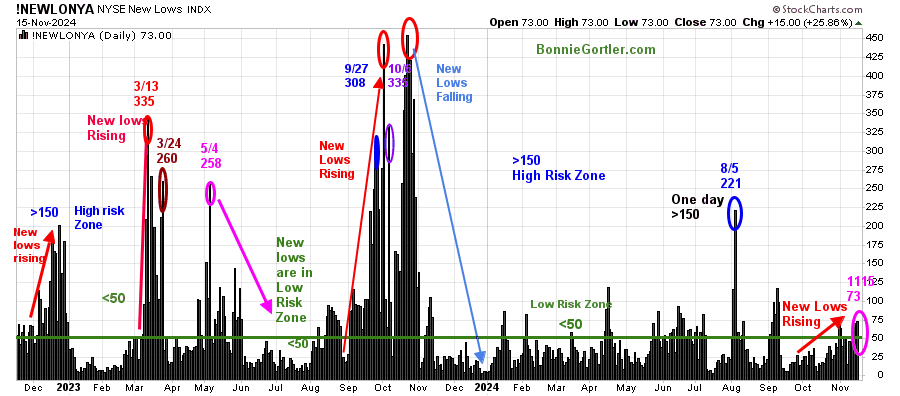
Figure 3: NYSE New Lows
Source: Stockcharts.com
New Lows on the NYSE remain in the lower risk zone, closing at 73 (pink circle) on 11/15/24. Learn more about the significance of New Lows in my book, Journey to Wealth, published on Amazon. If you would like a preview, get a free chapter here.
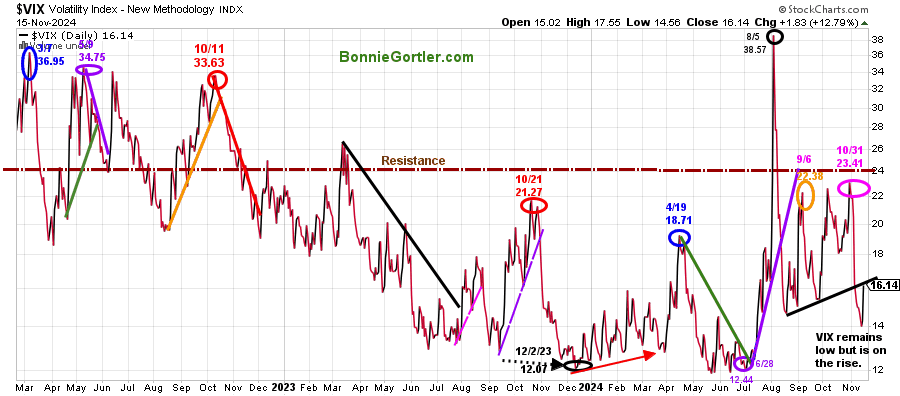
Figure 4: CBOE Volatility Index (VIX)
Source: Stockcharts.com
The CBOE Volatility Index (VIX), a measure of fear, remains low but is rising.
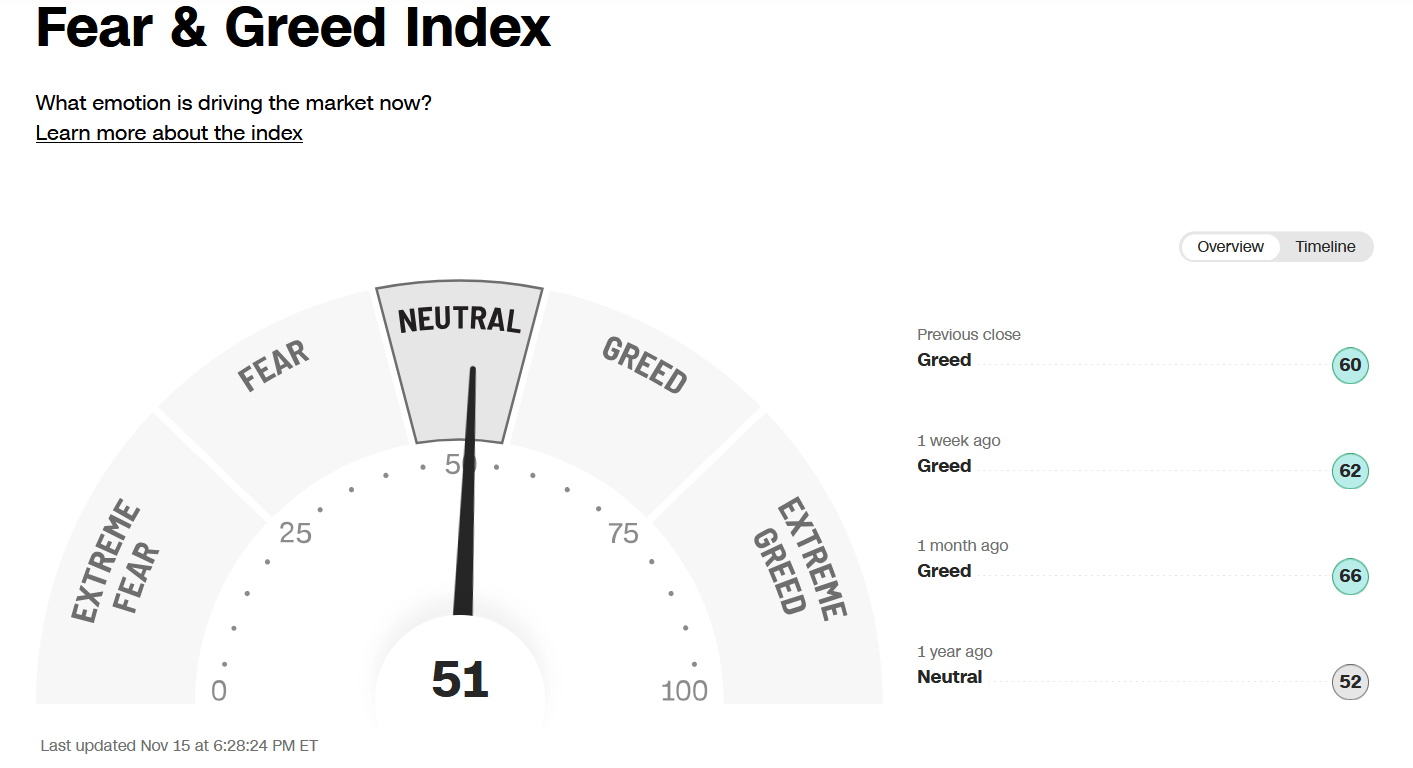
Figure 4: Fear & Greed Index
Source. CNN.com
Investor sentiment based on the Fear and Greed Index (a contrarian index) measures the market’s mood. The Fear and Greed Index down ticked from greed last week to neutral, closing at 51.
Are you interested in learning more about the stock market? Learn how to implement a powerful wealth-building mindset and simple, reliable strategies to help you grow your wealth in my eCourse Wealth Through Investing Made Simple. Learn more here.
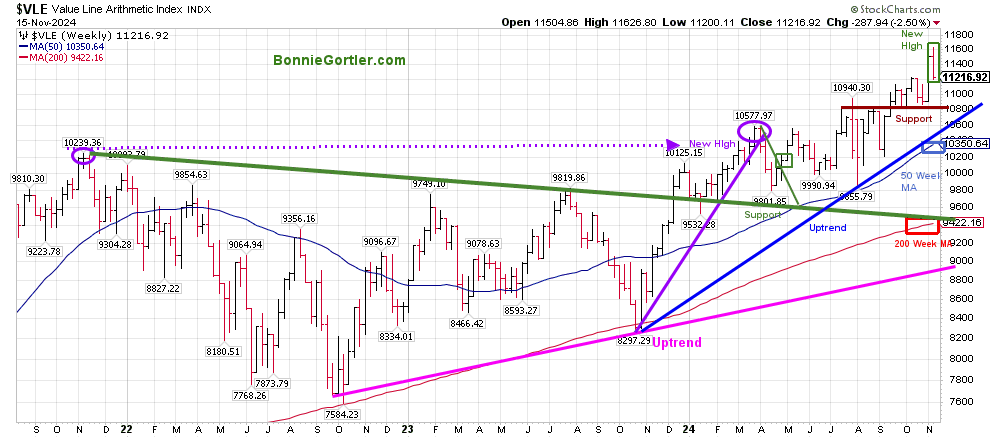
Figure 5: Value Line Arithmetic Average
Source: Stockcharts.com
The Value Line Arithmetic Index ($VLE) is a mix of approximately 1700 stocks.
VLE uptrend from October 2022 and October 2023 remains in effect. VLE making a new high is positive. VLE remains above the 50-week MA, which is rising (blue rectangle), and the 200-week MA (red rectangle), a sign of underlying strength.
Support is at 10800, followed by 10300,
It would be positive if VLE continues to hold support and takes out the high from last week, at 11626.80.
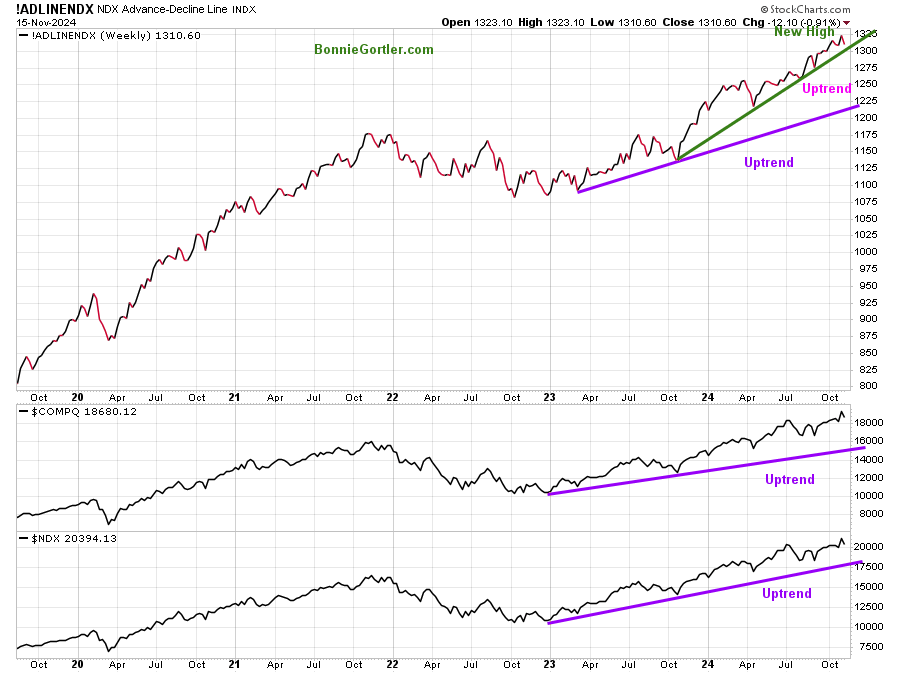
Figure 6: Nasdaq Advance Decline line (Top) Nasdaq Composite (Middle) Nasdaq 100 (Bottom)
Source: Stockcharts.com
The uptrend remains for the intermediate term for the NDX Advance Decline Line. Nasdaq Composite and NDX Index. Despite the decline last week, the bulls get the benefit of the doubt as long as the uptrends remain intact. However, a more significant correction may occur if the uptrends break.
In sum:
As long as the uptrend in the NDX Advance-Decline line, Nasdaq Composite, and Nasdaq 100 remain in effect, there is likely more upside.
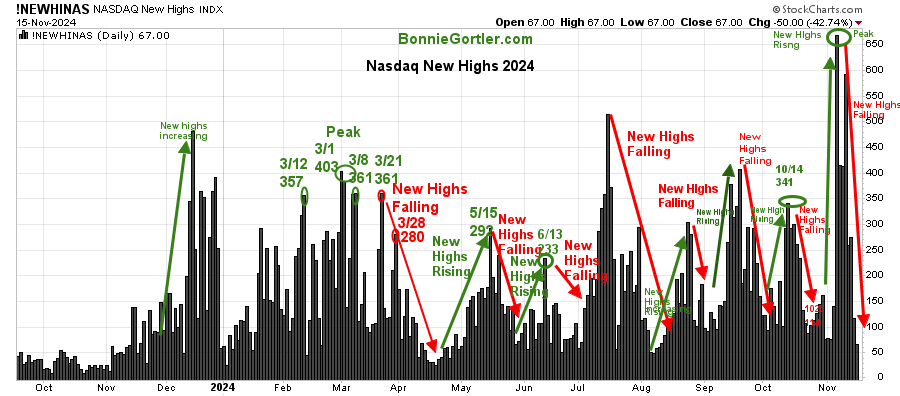
Figure 7:Nasdaq New Highs
Source: Stockcharts.com
New highs are falling after peaking early in the week.
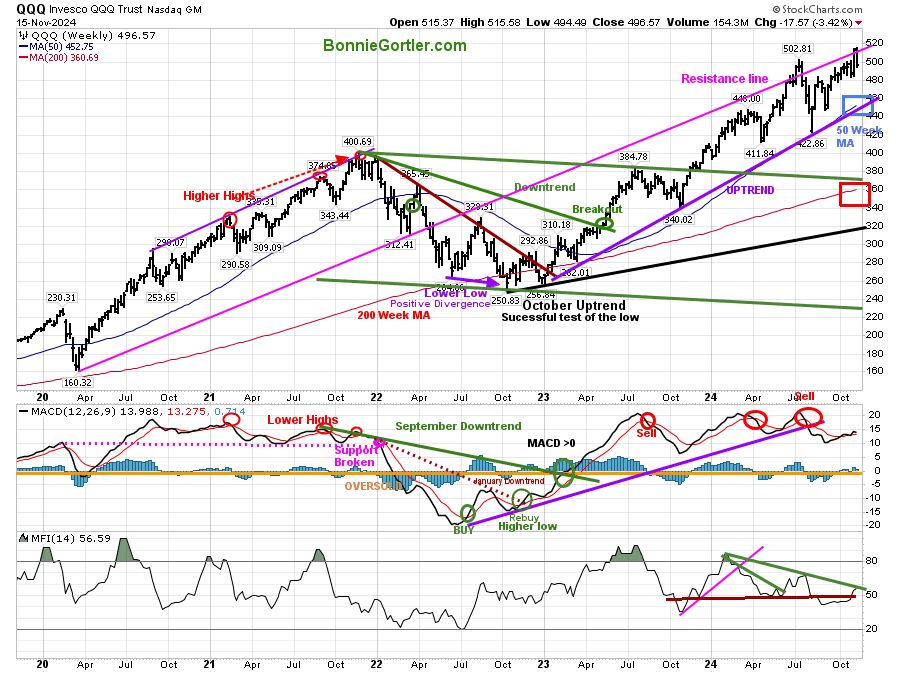
Figure 8: QQQ Weekly
Source: Stockcharts.com
It’s positive the QQQ intermediate uptrend from October 2023 remains intact. However, a weekly close below 480.00 will likely lead to further selling.
For more of Bonnie’s market charts, Click HERE.
Summing Up:
The major averages were all lower last week. Volatility increased, and breadth weakened. This time of the year is usually favorable. However, this has not been the case so far this year. It’s too early to say the peak of the market has occurred. However, further weakness breaking below support could accelerate last week’s decline before another rally attempt. Manage your risk, and your wealth will grow.
Let’s get to know each other better. If you have any questions or want to explore charts together, contact me at Bonnie@Bonniegortler.com.
If you like this market update, you will love my free Charting Charting Master Class. Sign up HERE.


