Bonnie’s Market Update 10/18/24
Bonnie’s Market Update 10/18/24
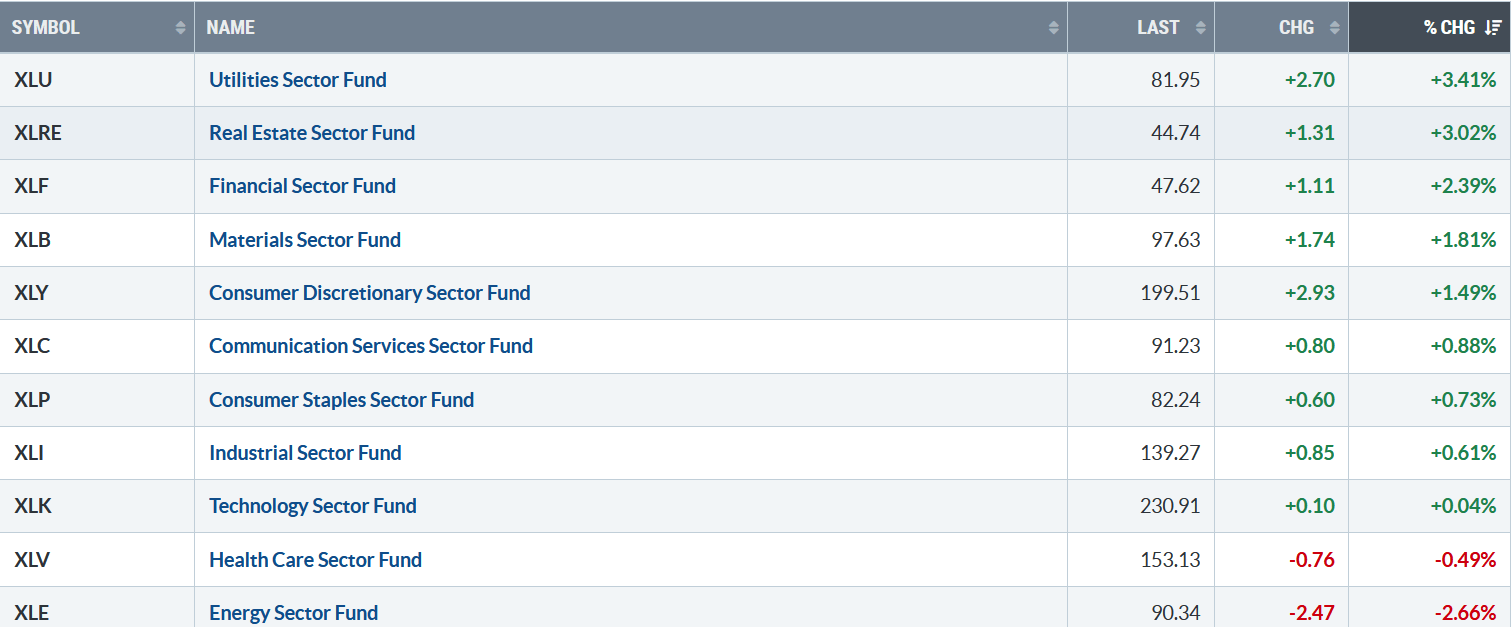
The rally continues. Nine of the eleven S&P SPDR sectors were higher last week. Utilities (XLU) and Real Estate (XLRE) were the strongest, while Healthcare (XLV) and Energy (XLE) were the weakest. The SPDR S&P 500 ETF Trust (SPY) gained +0.86%.
S&P SPDR Sector ETFs Performance Summary 10/11/24 – 10/18/24
Source: Stockcharts.com
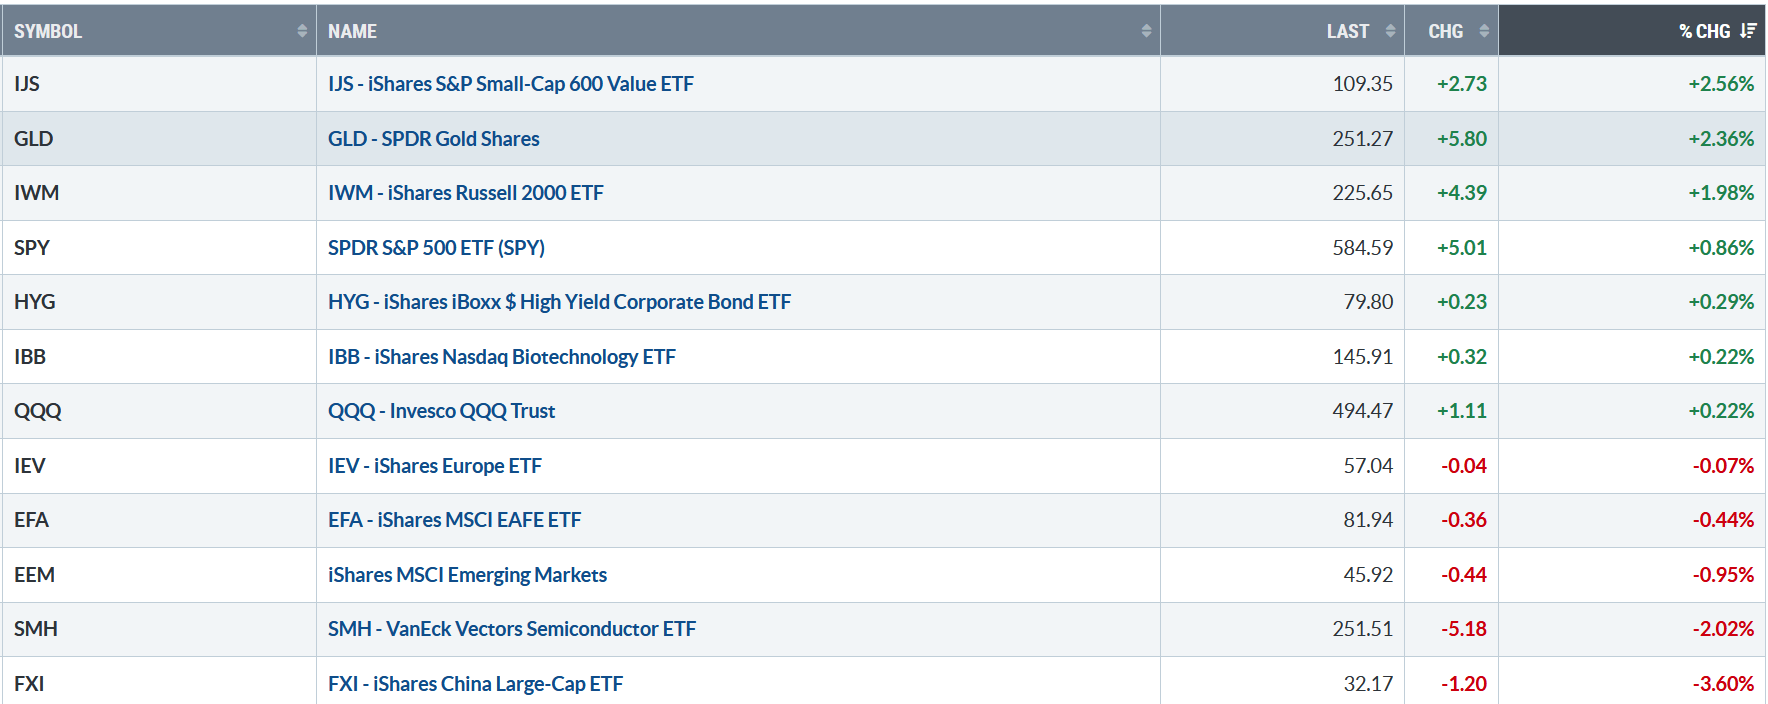
Figure 2: Bonnie’s ETFs Watch List Performance Summary 10/11/24 – 10/18/24
Source: Stockcharts.com
China fell for the second week but rallied sharply on Friday. Small-cap Value and Growth showed strength, along with Gold. Global markets and Semiconductors lagged.
You can explore Bonnie’s market charts from last week and more HERE.
A Few Favorites:
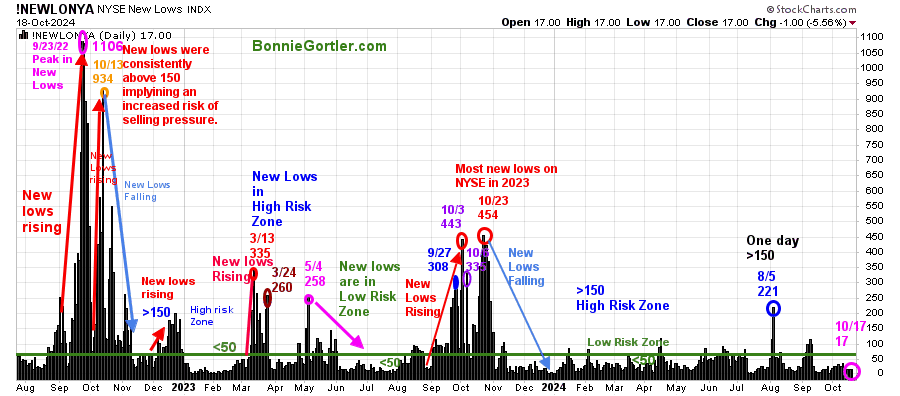
Figure 3: NYSE New Lows
Source: Stockcharts.com
New Lows on the NYSE remain in the lower risk zone, closing at 17 (pink circle) on 10/19/24. Learn more about the significance of New Lows in my book, Journey to Wealth, published on Amazon. If you would like a preview, get a free chapter here.
Source: Stockcharts.com
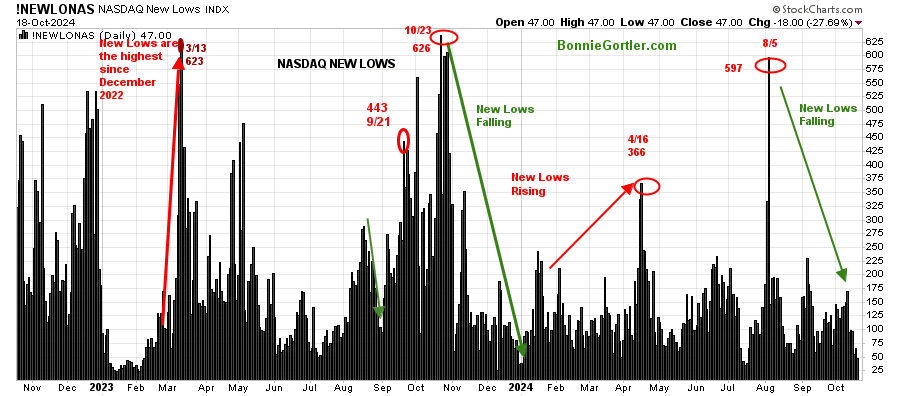
It’s positive Nasdaq New Lows are falling.
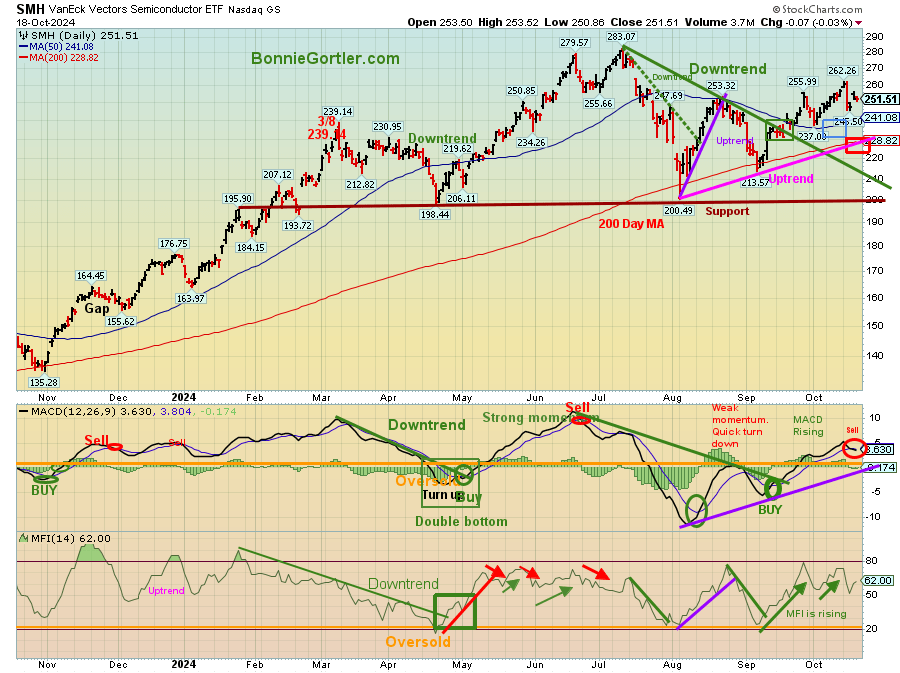
Figure 5: SMH Daily
Source: Stockcharts.com
SMH tends to be a leading indicator for the market when investors are willing to take on increased risk, and the opposite is true when the market is falling. Monitor SMH next week to see if they show leadership.
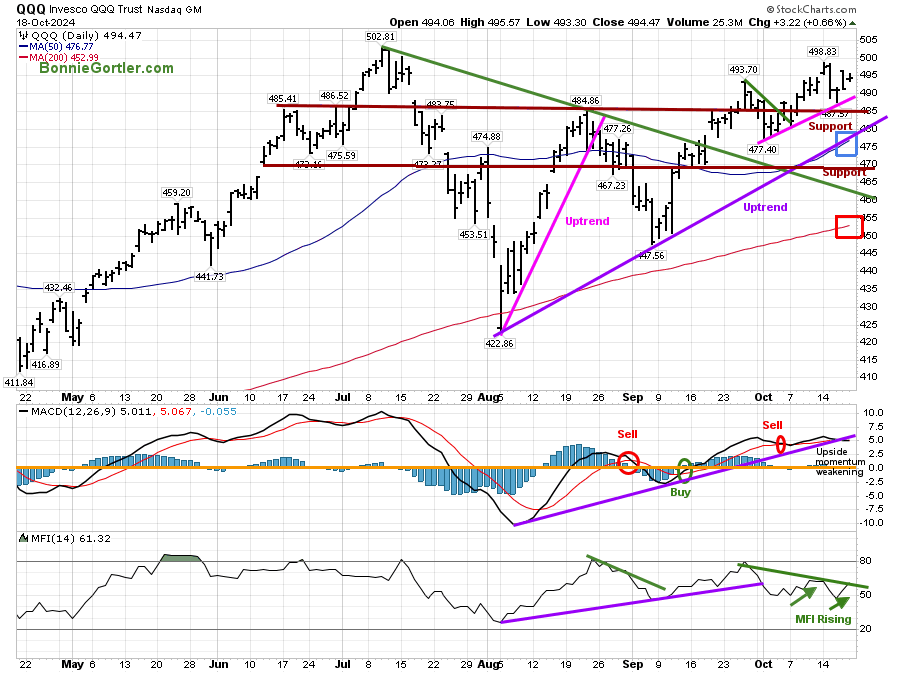
Figure 6: QQQ Daily
Source: Stockcharts.com
The QQQ uptrend from October 2024 and August 2024 remains intact.
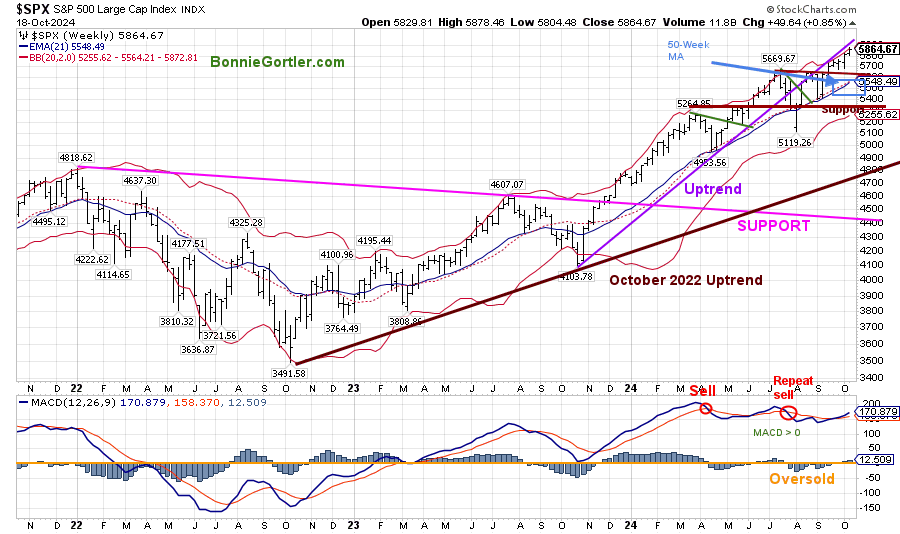
Figure 7: S&P 500 Weekly
Source: Stockcharts.com
The Intermediate trend in the S&P 500 from October 2022 remains in effect (brown line).
For more of Bonnie’s market charts from last week and more, Click HERE.
Summing Up:
The advance continued. The short-term and intermediate-term price trends remain up. Market breadth is positive. Earnings season continues, which could add to daily volatility. Support on the S&P 500 Index is at 5640 and 5400, while QQQ support is at 482.00 and 465.00. Short-term momentum patterns have started to weaken, but support levels continue to hold, implying the likelihood of further gains ahead until they are violated.
Let’s get to know each other better. If you have any questions or want to explore charts together, contact me at Bonnie@Bonniegortler.com. Alternatively, you can go directly to my calendar to schedule a time. Click HERE:
If you like this market update, you will love my free Charting Charting Master Class. Sign up HERE.


