Bonnie’s Market Update 10/11/24
Bonnie’s Market Update 10/11/24
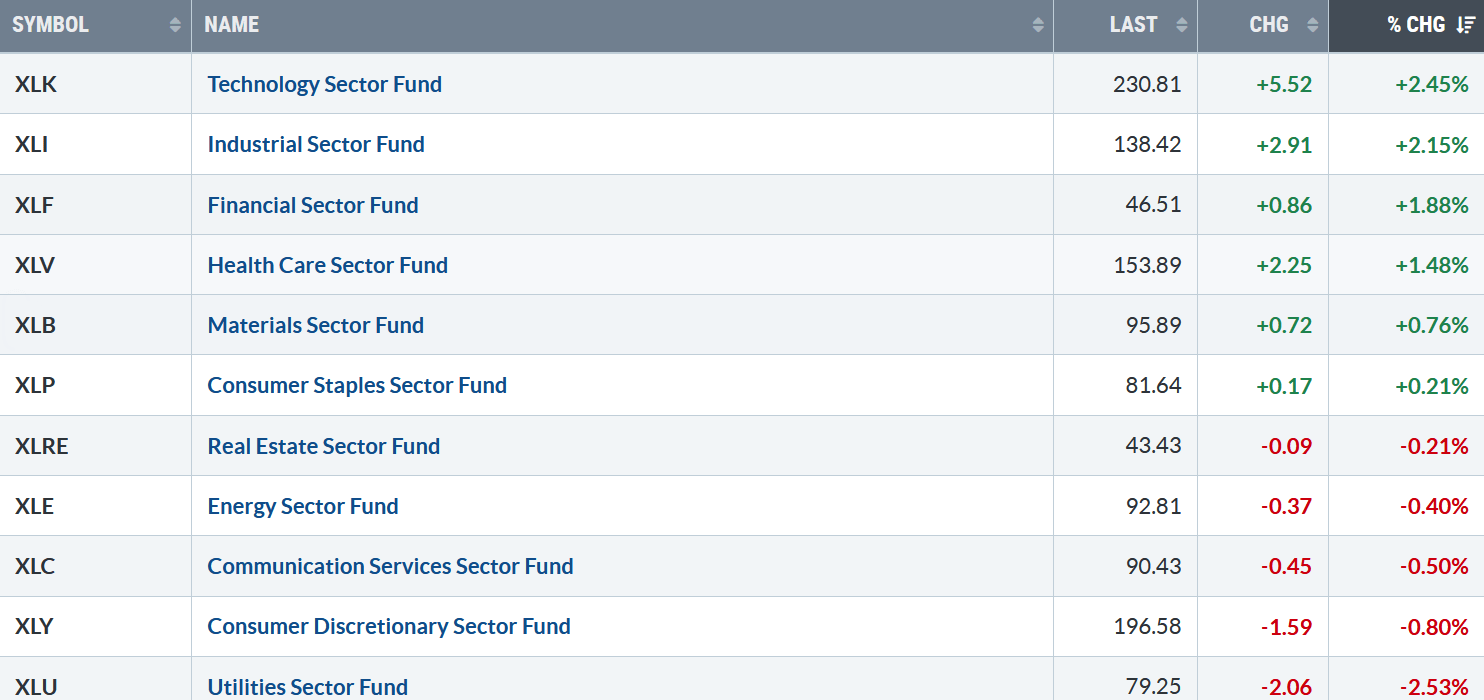
Gains for major averages continued. Six of the eleven S&P SPDR sectors were higher last week. Technology (XLF) and Industrials (XLI) were the strongest, while Consumer Discretionary (XLY) and Utilities (XLU) were the weakest. The SPDR S&P 500 ETF Trust (SPY) gained +1.15%.
S&P SPDR Sector ETFs Performance Summary 10/04/24 – 10/11/24
Source: Stockcharts.com
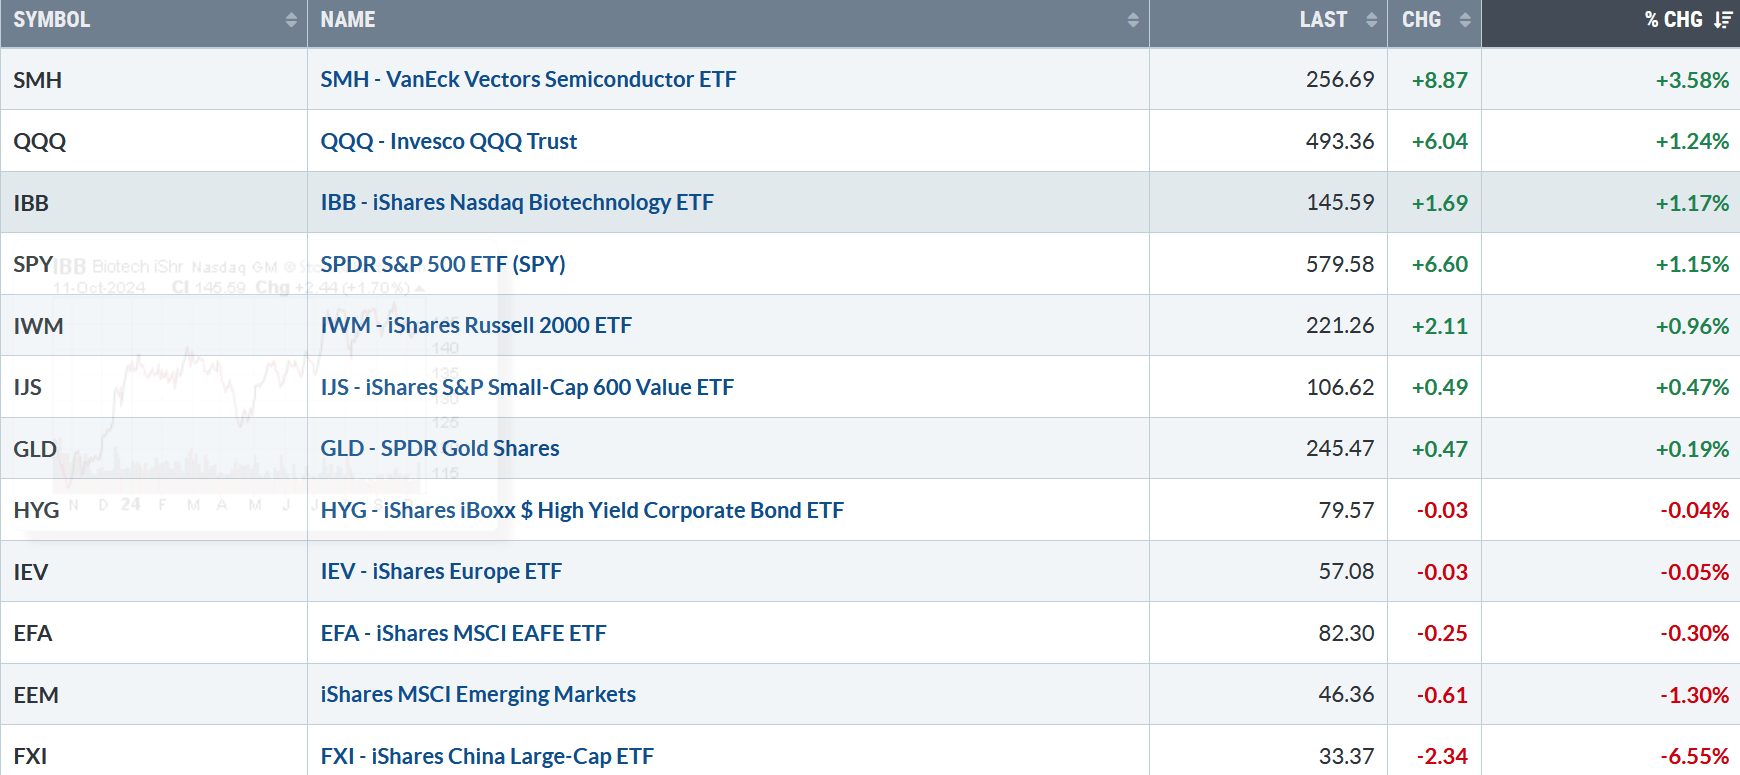
Figure 2: Bonnie’s ETFs Watch List Performance Summary 10/04/24 – 10/11/24
Source: Stockcharts.com
China’s stock market fell as profit-taking occurred after two weeks of significant gains. Semiconductors, Technology, Biotechnology, and Small-Cap Growth were higher as global markets lagged.
You can explore Bonnie’s market charts from last week and more HERE.
A Few Favorites:
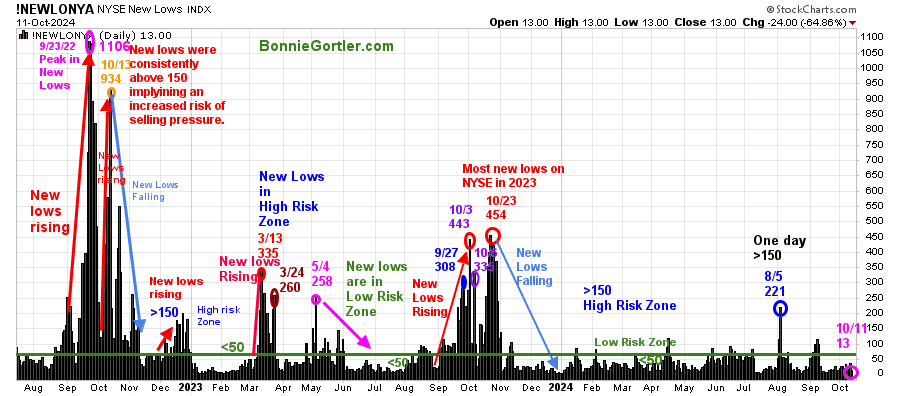
Figure 3: NYSE New Lows
Source: Stockcharts.com
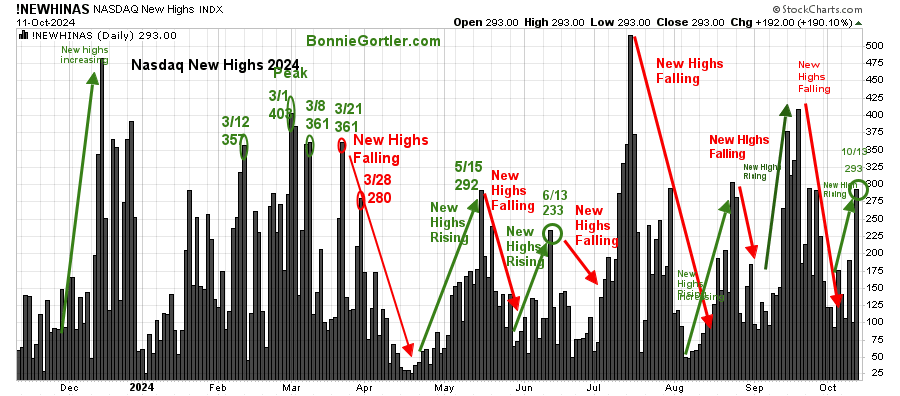
Figure 4: Nasdaq New Highs
Source: Stockcharts.com
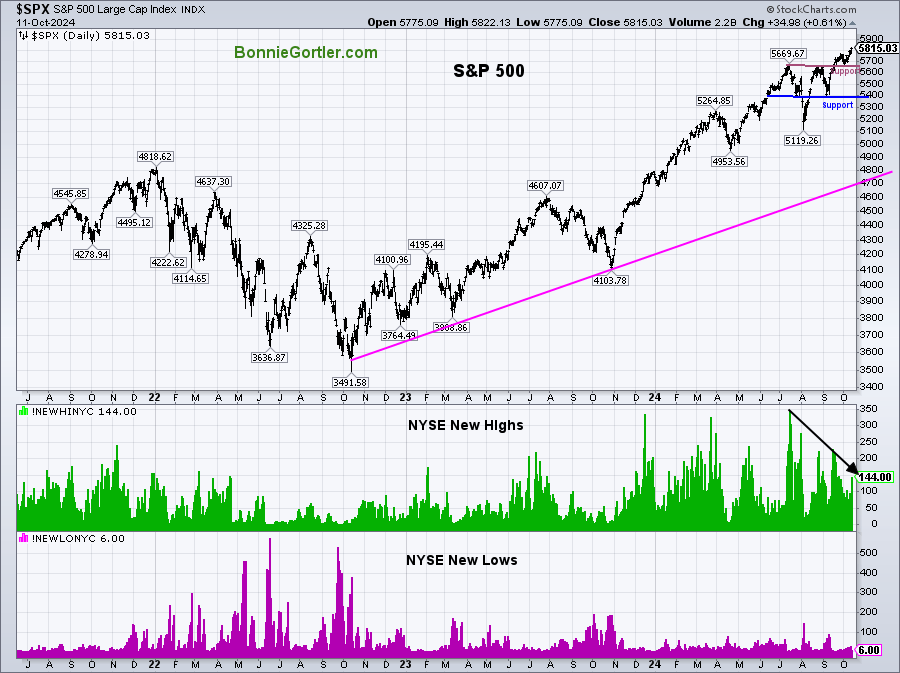
Figure 5: S&P 500 and NYSE New Highs and New Lows
Source: Stockcharts.com
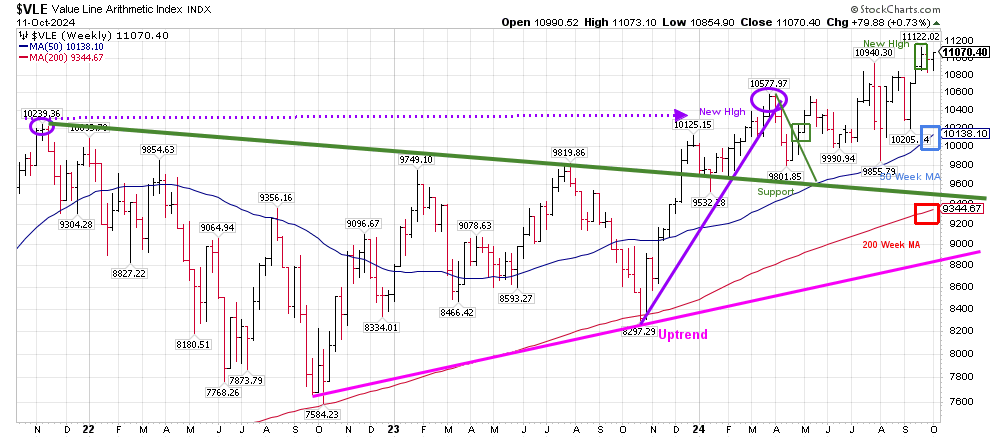
Figure 6: Valueline Arithmetic Index Weekly
Source: Stockcharts.com
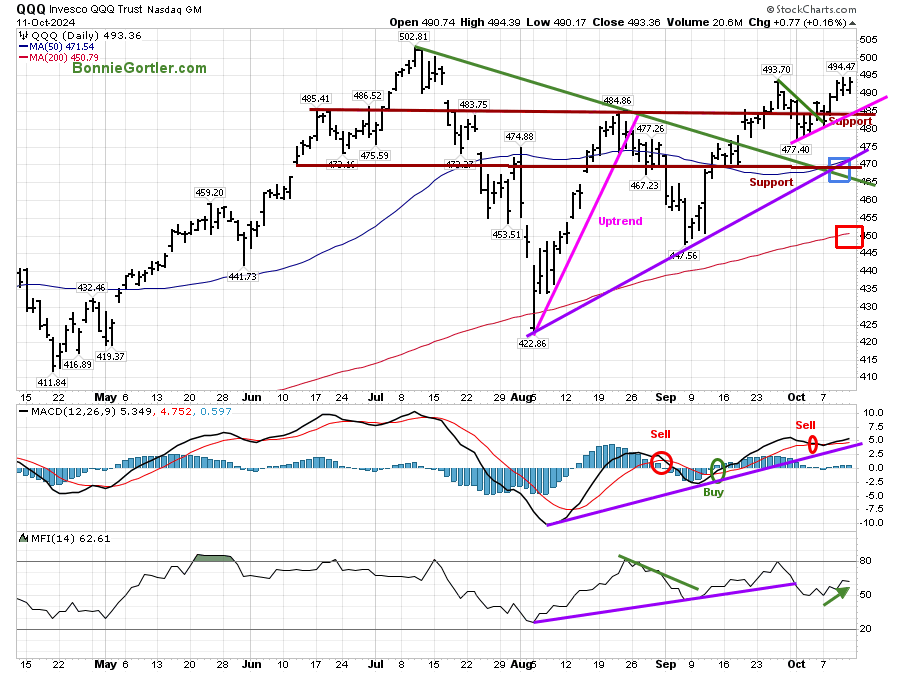
Figure 7: QQQ Daily
Source: Stockcharts.com
For more of Bonnie’s market charts from last week and more, Click HERE.
Summing Up:
The major averages closed near their highs on Friday. The short-term trend remains up. Market breadth improved in the latter part of the week. Nasdaq had the most new highs since mid-September, which are rising, and New Lows on The NYSE remain in a low-risk zone. Support on the S&P 500 Index is 5650 and 5400. QQQ support is 482.00 and 465.00. Earnings season continues, which could add to daily volatility. As long as support holds, the odds favor the bulls for the market to work higher in the short term.
Let’s get to know each other better. If you have any questions or want to explore charts together, contact me at Bonnie@Bonniegortler.com. Alternatively, you can go directly to my calendar to schedule a time. Click HERE:
If you like this market update, you will love my free Charting Charting Master Class. Sign up here.


