Bonnie’s Market Update 1/03/25
Bonnie’s Market Update 1/03/25
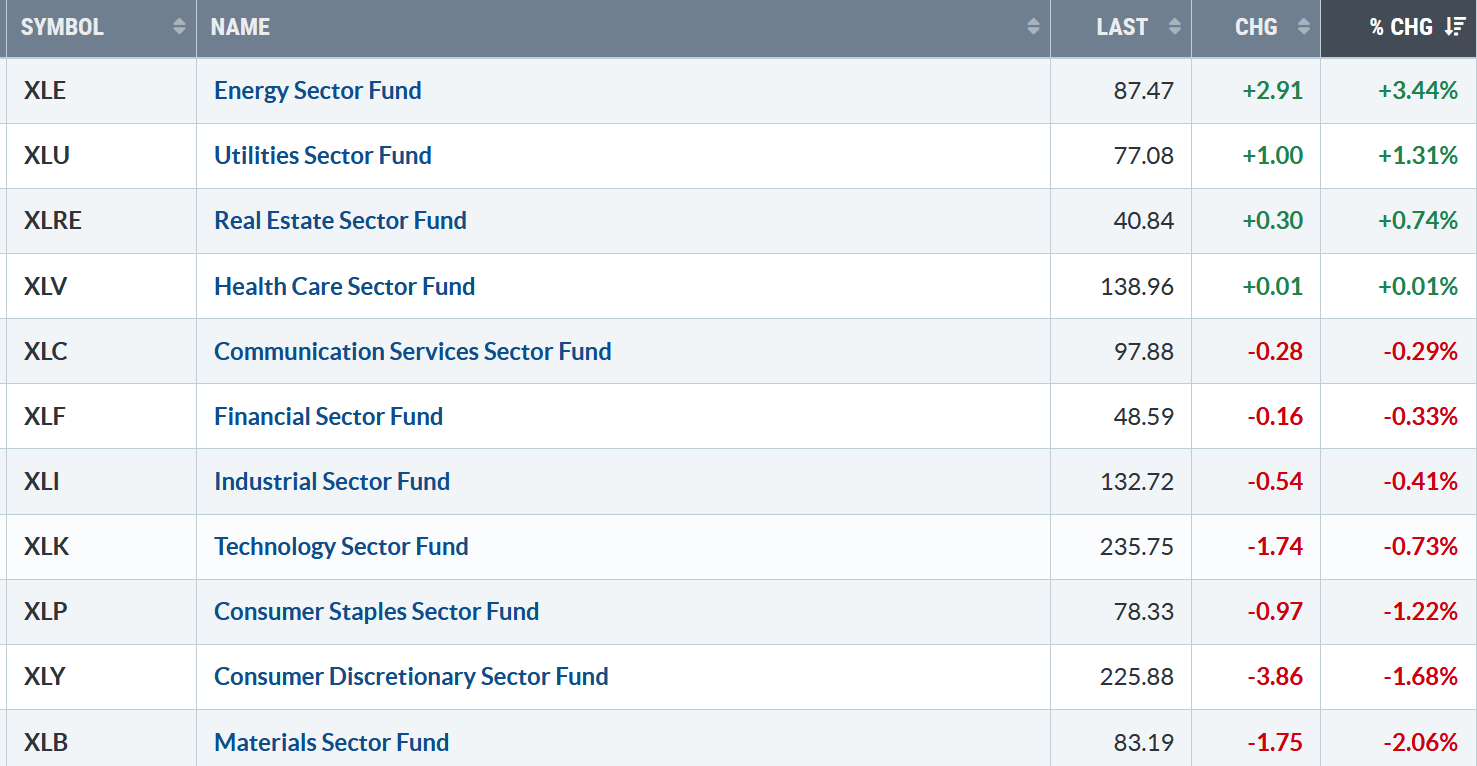
A shaky start to 2025. Only four of the eleven S&P SPDR sectors were higher last week. Energy (XLE) and Utilities (XLU) were the leading sectors, while Consumer Discretionary (XLY) and Materials (XLB) were the weakest sectors. The SPDR S&P 500 ETF Trust (SPY) fell -0.51%.
S&P SPDR Sector ETFs Performance Summary 12/27/24 – 1/3/25
Source: Stockcharts.com
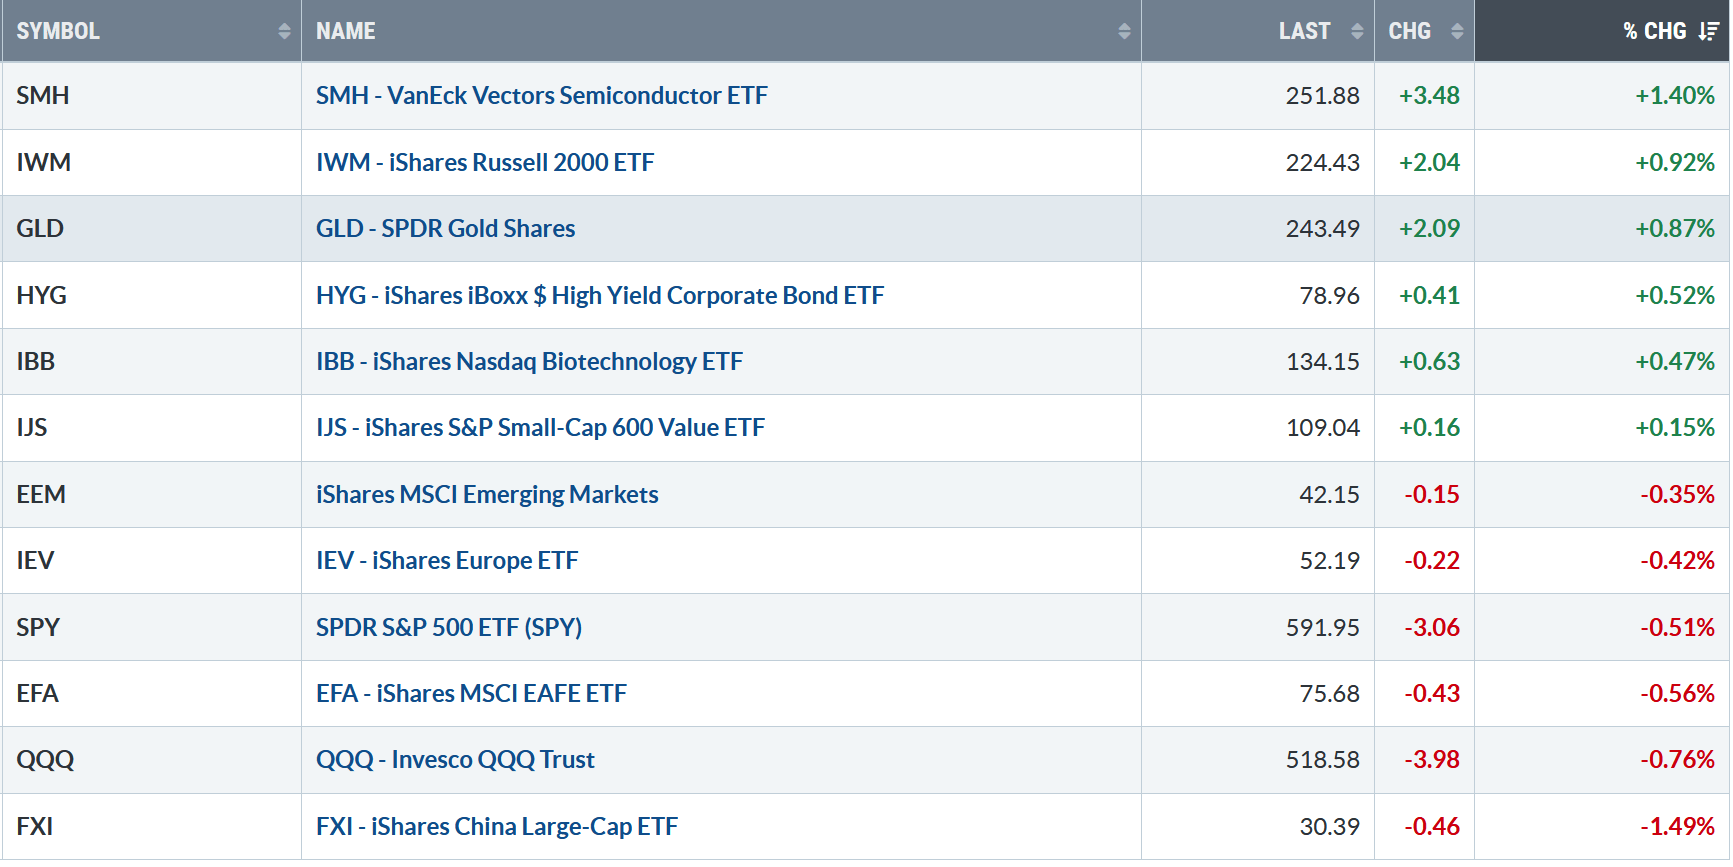
Figure 2: Bonnie’s ETFs Watch List Performance Summary 12/27/24 – 1/3/25
Source: Stockcharts.com
Semiconductors, Small Cap Growth, and Gold led, while China, Technology, and global markets lagged last week.
I invite you to join my Facebook Group. Learn more about it here: Wealth Through Market Charts.
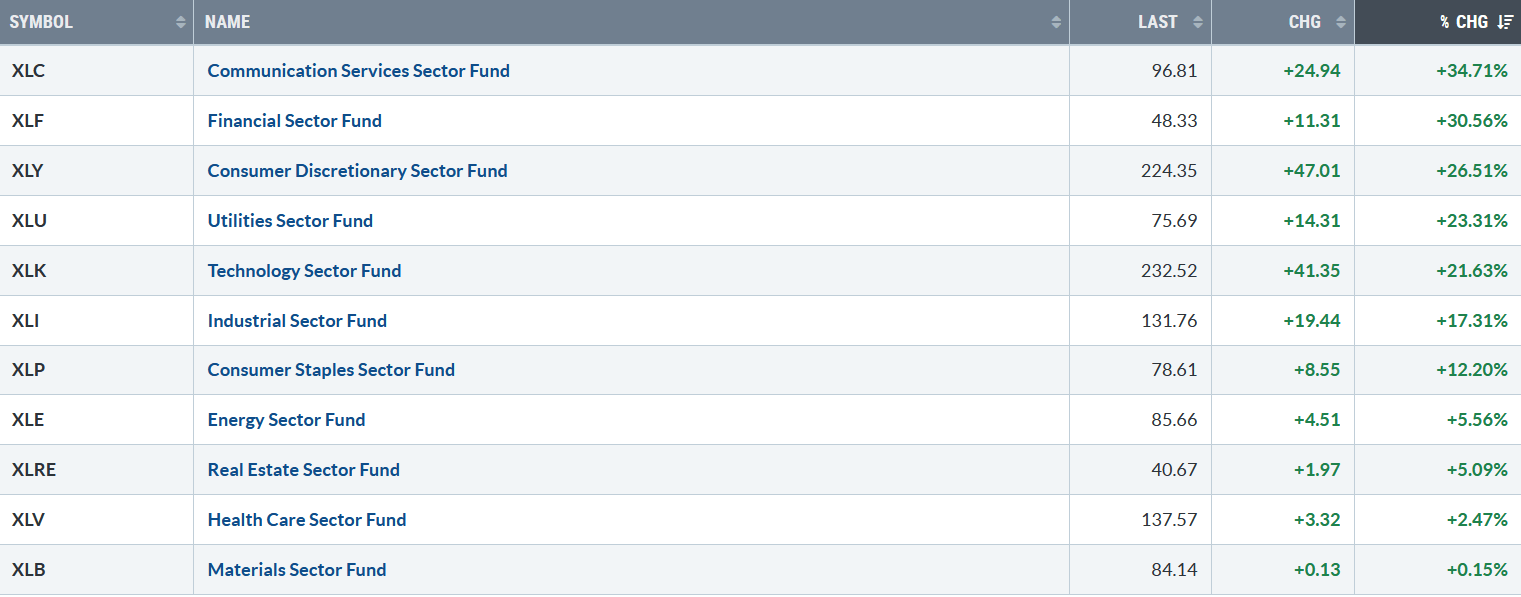
Figure 3: S&P SPDR Sector ETFs YTD Performance Summary 12/29/23 – 12/31/24
Source: Stockcharts.com
2024 followed 2023 significant gains. All eleven S&P SPDR sectors finished higher for the year. Consumer Services (XLC) and Financial Services were the strongest sectors, while Health Care (XLV) and Materials were the weakest. The SPDR S&P 500 ETF Trust (SPY) gained +24.89%.
You can explore Bonnie’s market charts from last week and more HERE.
Charts to Watch:
Figure 4: UST 10YR Bond Yields Daily
Source: Stockcharts.com
The 10-year U.S. Treasury fell last week, closing at 4.596 but trending higher since September.
Learn how to implement a powerful wealth-building mindset and charting strategies to help you grow your wealth in the comfort of your home in my eCourse Wealth Through Investing Made Simple. Learn more here.
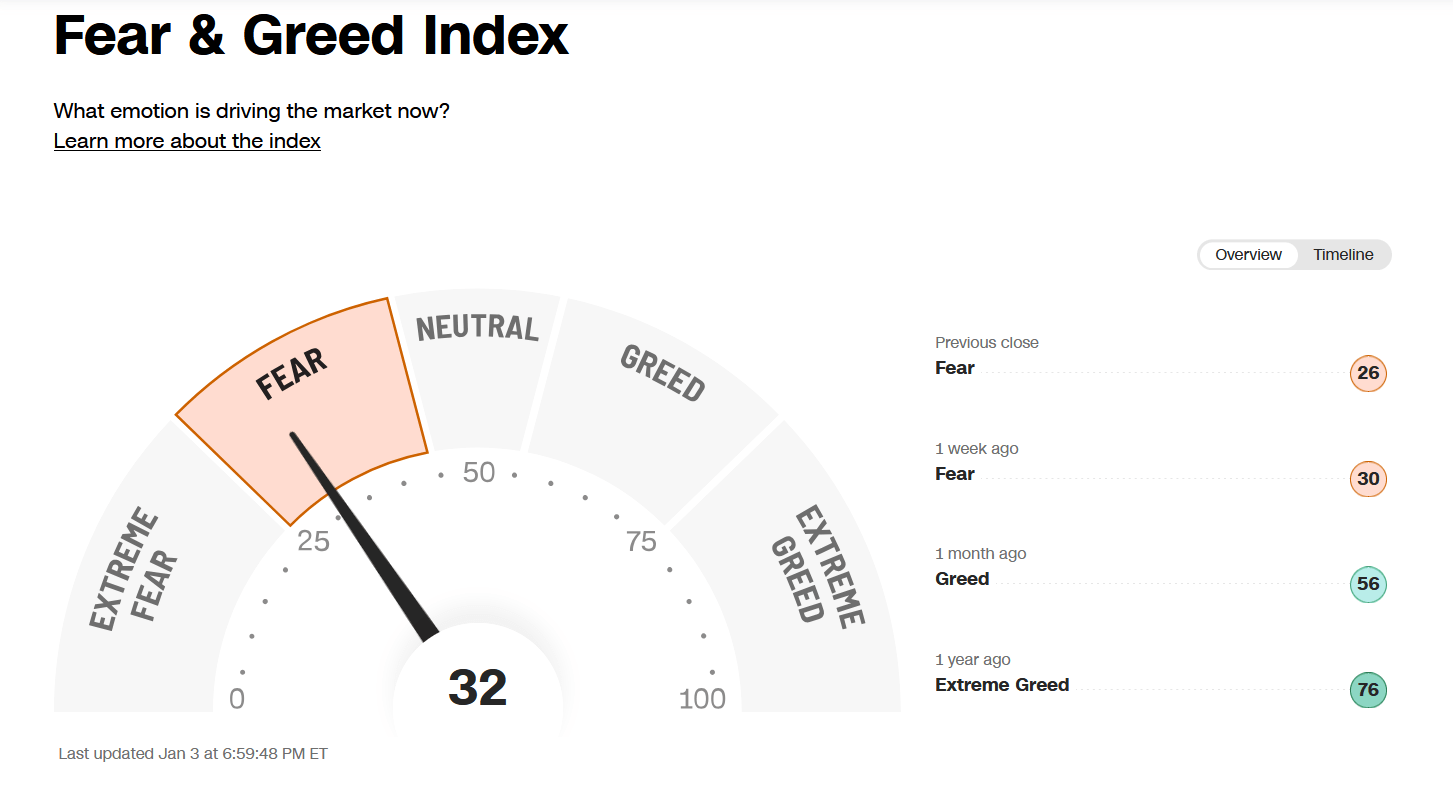
Figure 5: Fear & Greed Index
Source. CNN.com
Investor sentiment, measured by the Fear and Greed Index (a contrarian index), measures the market’s mood. Last week, the Index fell, closing at 32, showing fear.
Figure 6: NYSE New Lows
Source: Stockcharts.com
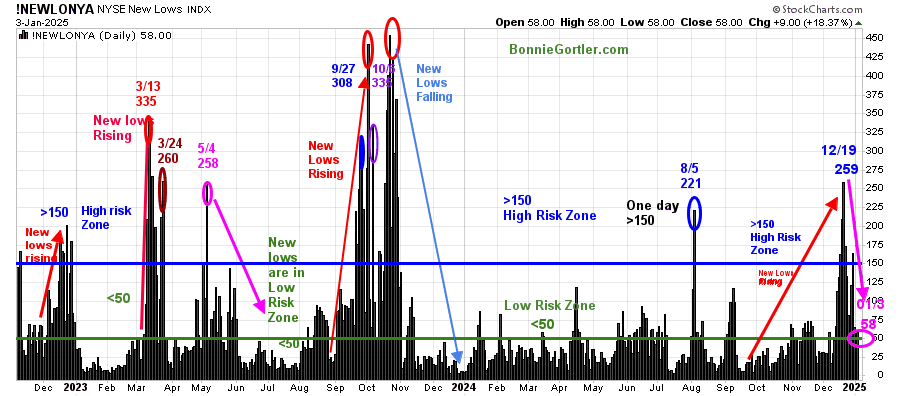
New Lows on the NYSE rose in December, peaking at 259, but have contracted no longer in the high-risk zone above 150, closing at 58 (pink circle) on 01/03/25.
Watch New Lows closely now to see if they rise or fall. If new lows fall between 25 and 50, it will be positive in the short term. On the other hand, an increase above 150 and continuing to expand would be a warning sign of more weakness ahead.
Learn more about the significance of New Lows in my book, Journey to Wealth, published on Amazon. If you would like a preview, get a free chapter here.
Figure 7: CBOE Volatility Index (VIX)
Source: Stockcharts.com
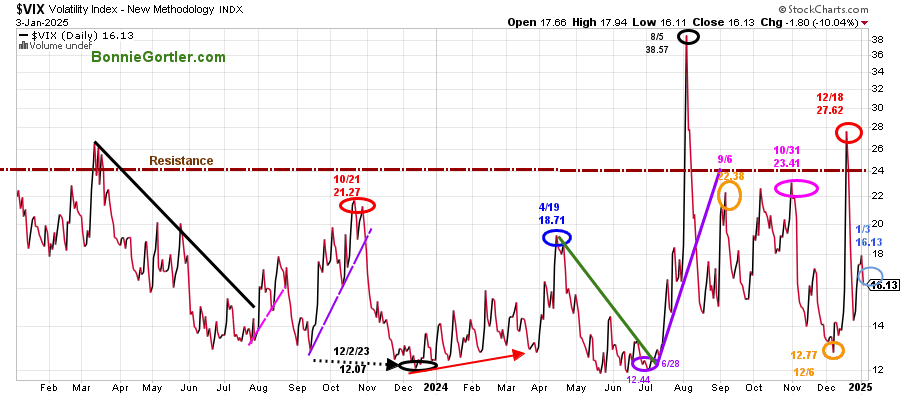
The CBOE Volatility Index (VIX), a measure of fear, after a low on 12/6 of 12.77, rose to 27.62 on 12/18. Last week, VIX rose slightly to close at 16.13 as equity prices fell. A decline in VIX would be positive for equities.
Figure 8: Value Line Arithmetic Average
Source: Stockcharts.com
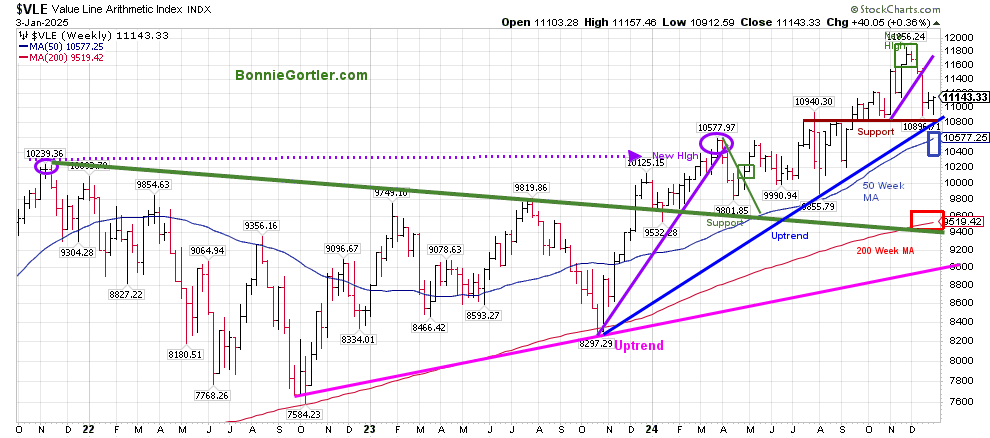
The Value Line Arithmetic Index ($VLE) is a mix of approximately 1700 stocks. The VLE uptrend from October 2022 (pink line) and October 2023 (blue line) remains in effect.
The October 2024 trendline (purple line) broke three weeks ago, and a pullback followed, but VLE has remained above support so far. It remains positive that VLE closed near its high for the week and closed above the rising 50-week MA (blue rectangle) and the 200-week MA (red rectangle), a sign of underlying strength.
Support is 10800, followed by 10500. Resistance is 11600. It would be positive if VLE closes above 11220 in the short term and then has enough strength to close above the 11/25 high at 11856.24.
Figure 9: Daily iShares Russell 2000 (IWM) Price (Top) and 12-26-9 MACD (Middle) and Money Flow (Bottom)
Source: Stockcharts.com
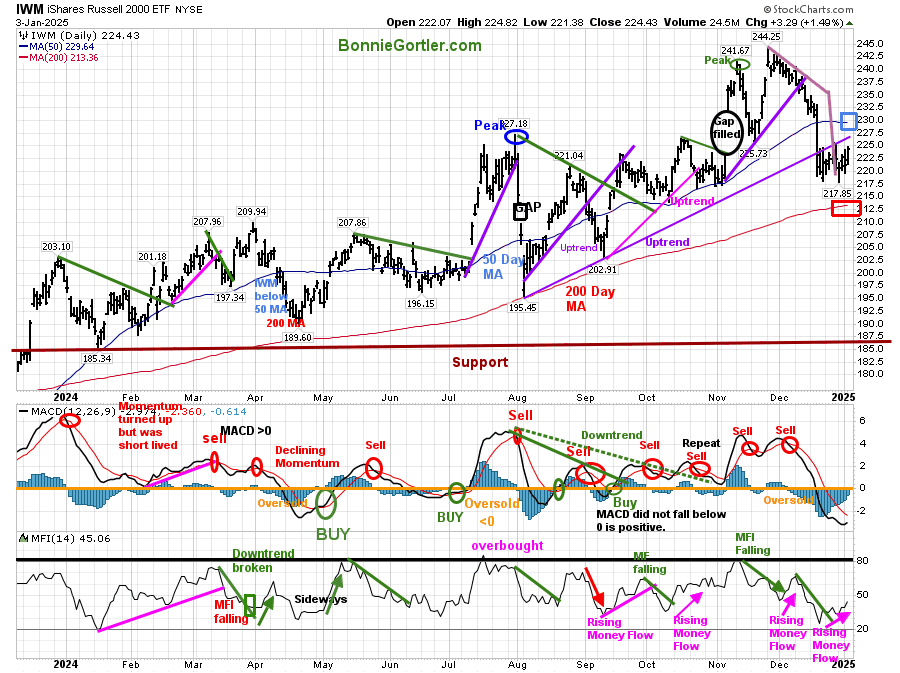
The top chart is the daily iShares Russell 2000 Index ETF (IWM), the benchmark for small-cap stocks, with a 50-Day Moving Average (MA) (blue rectangle) and 200-Day Moving Average (MA) (red rectangle) that traders watch and use to define trends.
IWM rose 1.49% last week. It’s unfavorable that IWM broke its short-term November uptrend and is now trading below the August uptrend (purple line) and the 50-day Moving Average. On the plus side, MACD is short-term oversold, is below 0, and is rising in position for a fresh MACD buy. Its positive Money Flow broke the downtrend from December 24 and is now rising.
Two closes above 231.00 would be positive in the short term.
You can explore Bonnie’s market charts from last week and more HERE.
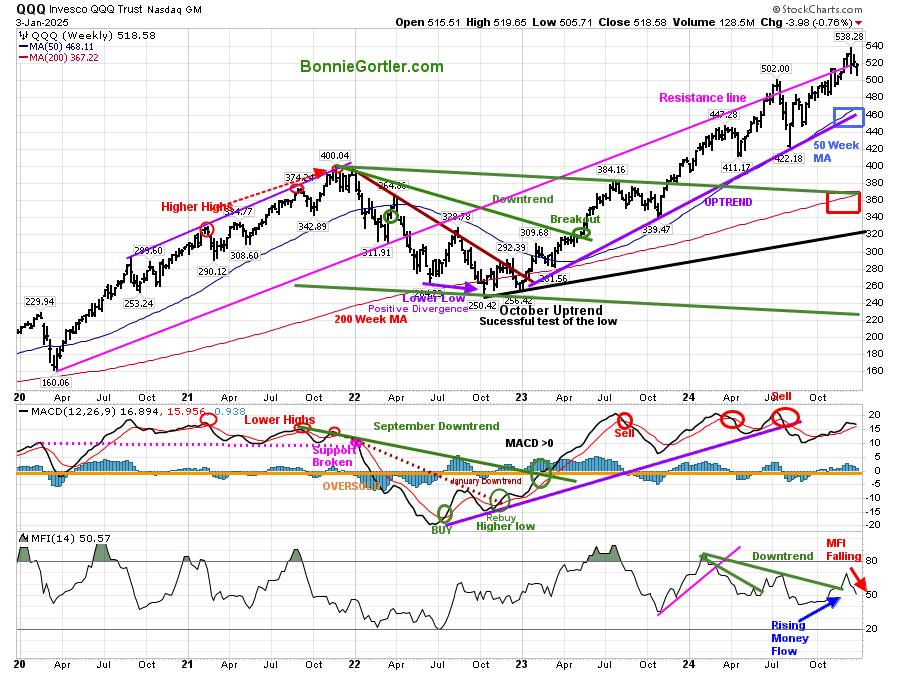
Figure 10: QQQ Weekly
Source: Stockcharts.com
It’s positive the QQQ intermediate uptrend from October 2023 remains intact (purple line). However, momentum has weakened, and Money Flow is falling.
QQQ fell +0.76% but rose sharply on Friday, gaining 1.64% as buyers stepped in willing to take on risk.
Support is 500.00, followed by 480.00 and 460.00. Resistance is at 530.00 and 540.00.
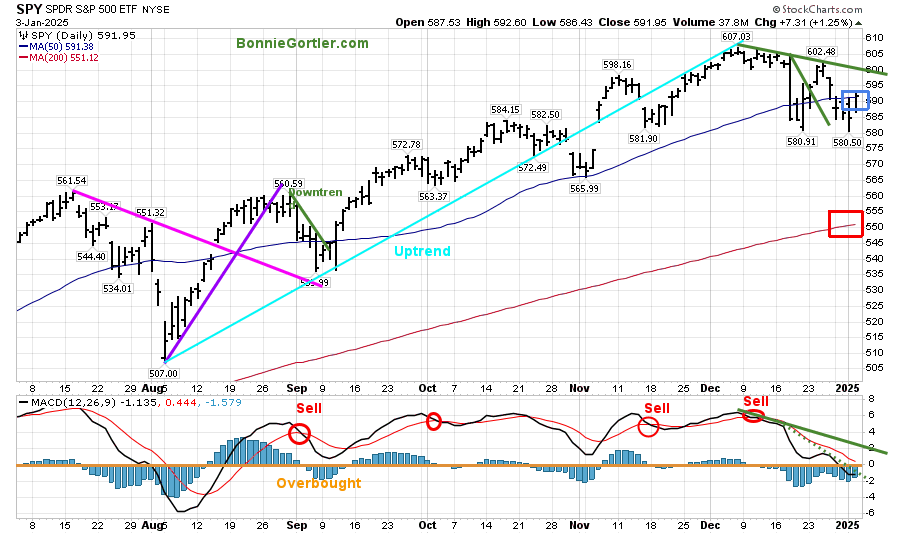
Figure 11: SPY Daily
Source: Stockcharts.com
The S&P 500 (SPY) remains in a downtrend from its peak in December.
SPY closed at 591.95, up 1.25% on Friday, near its weekly high. During the decline early last week, it was positive that SPY held the intermediate support at 580.00.
Support is at 586.00, 580.00, followed by 550.00. Resistance is at 603.00.
For more of Bonnie’s market charts, Click HERE.
Summing Up:
Friday’s tape action was positive after early weakness early in the week. The intermediate and long-term trends remain up. Support levels remain intact as fear is high and technicals are short-term oversold. A successful test of the December low appears to have occurred last week, implying higher prices are likely ahead in the near term. Time will tell. Manage your risk, and your wealth will grow.
Let us get to know each other better. If you have any questions or want to explore charts together, contact me at Bonnie@Bonniegortler.com.
If you like this market update, you will love my free Charting Charting Master Class. Sign up HERE.


