Biotechnology Bites the Dust: Long Term Trend Is Down
The stock market rallied on the last day of month, the worst January since 2009. Investors were optimistic that the decline might be short-lived and better times could be ahead. This feeling didn’t last very long.
February has started off lower, with the market moving fast and furious showing bear market tape action. Intraday swings in the S&P 500 (SPY) continue to be greater than 1%. These are happy timeswhen the market goes up, but stressful times when the move is down.
Wider intra-day moves in sectors that have been supporting the market such as:
• Finance (KRE, XLF) and
• Biotech (XBI, IBB) have been losing relative strength to the S&P 500 (SPY). This is not a healthy sign for the market going forward. Investors have moved away from riskier stocks and have fl ocked to defensive sectors such as
• Utilities (XLU) and
• Consumer Staples (XLP) as these sectors are more forgiving.
Don’t get too comfortable, because they could be next to fall if investors decide to throw in the towel on all asset classes if panic selling occurs.
High Volatility is Worrisome
The very oversold short term condition that existed after the correction earlier in January is no longer supporting the market. The tape had started to improve, but with high oil volatility, technology weakening, financials breaking down, uncertainty overseas, and the short term up cycle running out, further weakness could lie ahead.
The rally had enough steam after the intra-day low on 1/20/16 at 181.02 to get the S&P 500 (SPY) above 190.00 for two days which potentially could have started another leg up, however the S&P 500 failed to get through resistance at 195.00.
Another test of the January lows could still occur. Reflex rallies that fail are common when theintermediate and long term trend is down. Our trading models remain negative, signifying significant levels of risk. A safer opportunity will present itself in time. For now caution is advised: tread lightly, and be patient. Risk is high. The market might get worse before it gets better.
What Are The Charts Saying?
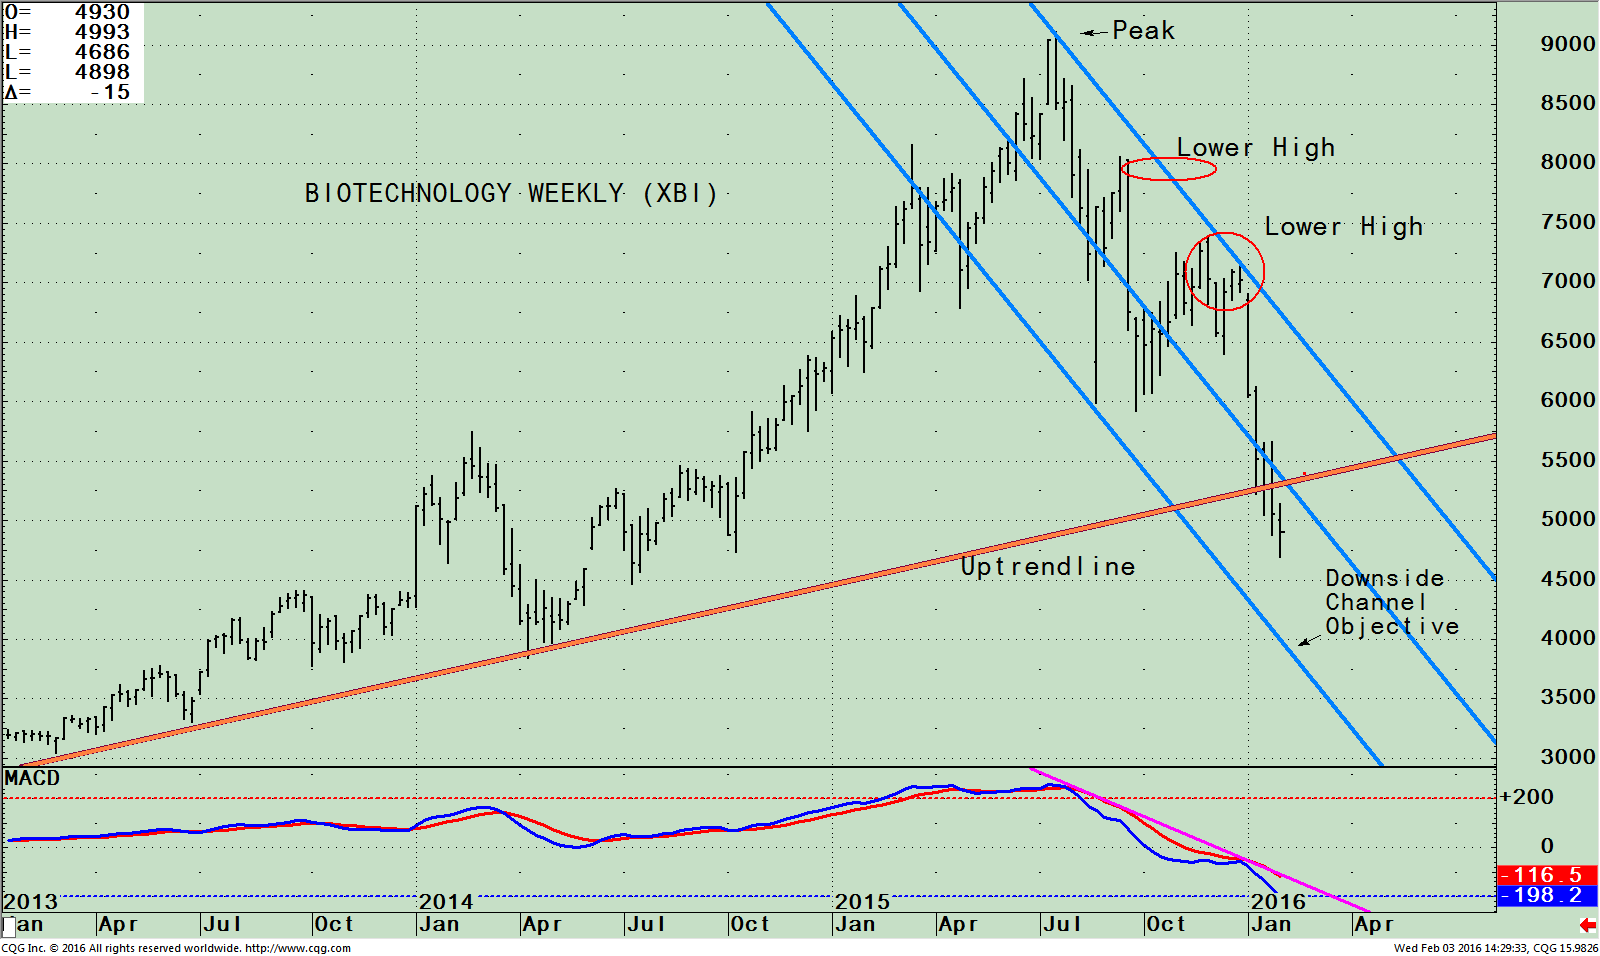
The SPDR S&P Biotech ETF (XBI) Weekly Index and MACD (Bottom)
The chart above is the SPDR S&P Biotech ETF (XBI), an index made up of U.S. biotech stocks that are equally weighted, emphasizing small and micro caps. The top 10 holdings are all less than 2%, which greatly reducing the risk if one stock gets hammered, but it’s a highly volatile ETF, with swings of more than 5% a day.
The Biotech index ETF (XBI) has been a profitable sector to be invested in since 2013, peaking 07/20/15. Biotech (XBI) has made a few rally attempts since the July peak, however all rallies failed to make a higher high but instead has made lower lows, forming a clear downside channel (blue lines).
If the tape action of the market were better, and if so many averages were not in an intermediate and long-term downtrend, then XBI would have already formed a pattern with higher lows by now.
Instead, XBI has broken below its middle channel and now has a downside target to 40.00, leaving a trail of lower highs that will act as resistance later.
Also notice that the uptrend from February 2013 (orange line) has now been broken for three weeks, long enough for me to feel it’s not a temporary overshoot but a significant breakdown in the trend.
The bottom part of the chart is MACD, a technical indicator that measures momentum clearly showing weakening momentum. After moving sideways for weeks, MACD instead of going up failed, and turned down. MACD is oversold and below 0, an area where favorable rallies occur but with the trend down risk is high and some nasty decline do occur, especially when the long term trend is down. No safe buy yet. More patience is required.
The SPDR S&P Biotech ETF (XBI) Monthly Index and MACD (Bottom)

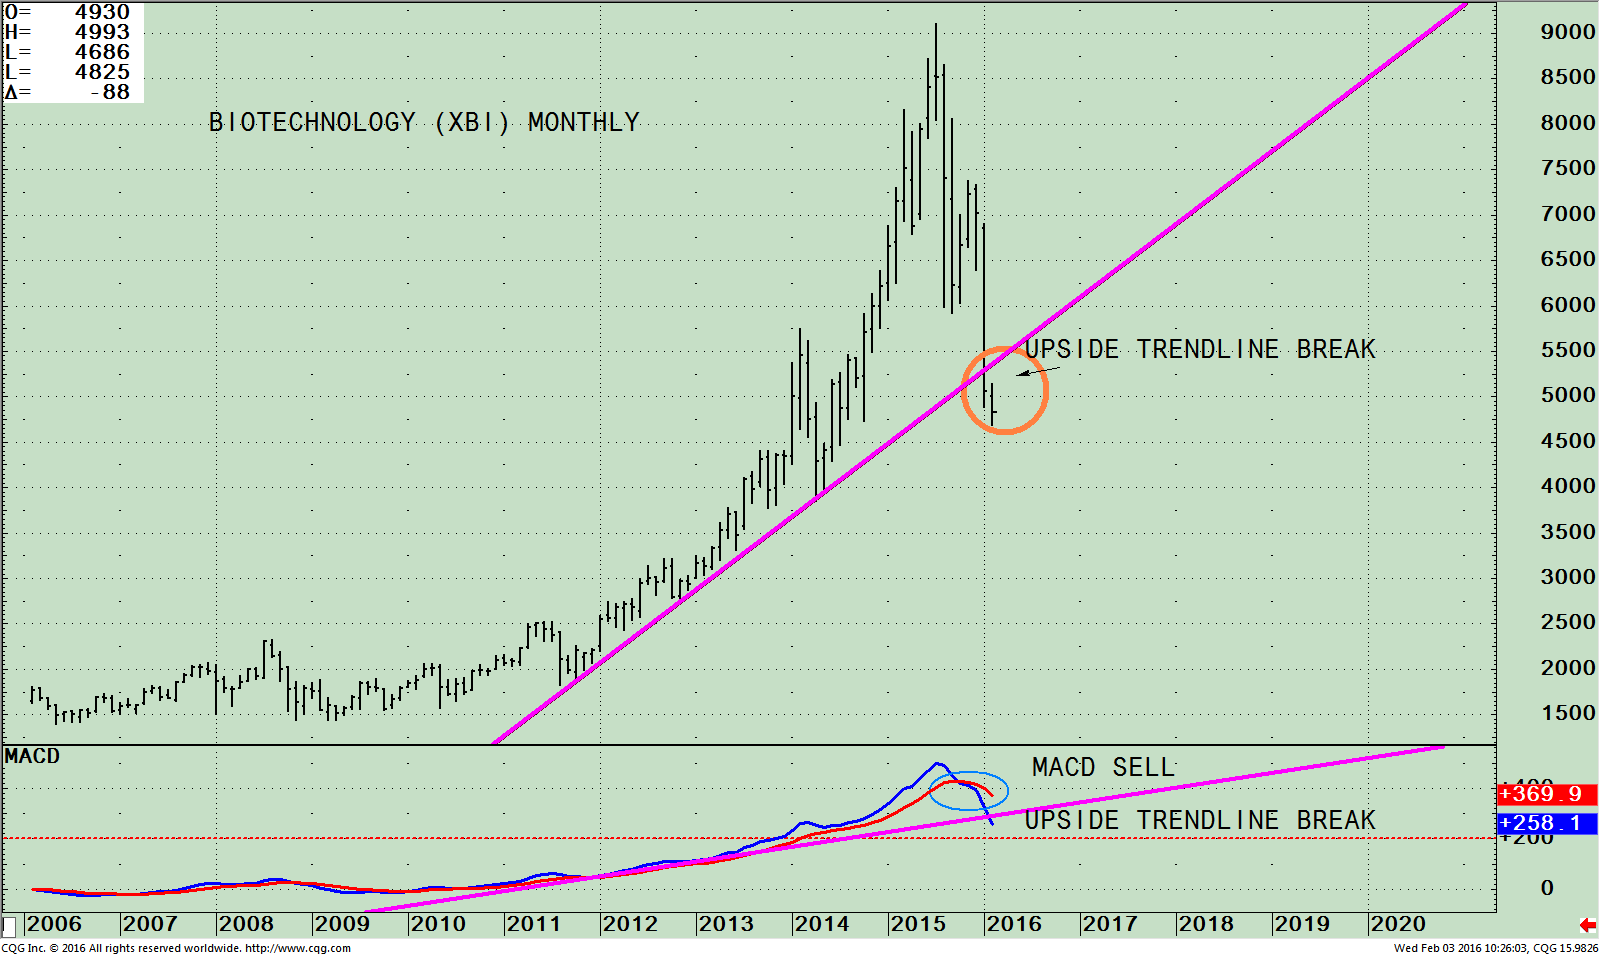
Biotechnology (XBI) is one of the last sectors to be in an uptrend. The monthly Biotech chart is clear. In January Biotechnology has broken the uptrend from 2011. The bull market is over for Biotech!
This breakdown in price has also been confirmed by MACD. XBI has fallen 44% from its high, now trading at 48.25 intraday (on 2/03/16). Expect investors to move their money out of the Biotechnology sector. Resistance is between 53 and 55, an ideal area for a reflex rally to stall, the area where the XBI broke down. If biotech does move towards resistance, it’s a good zone to reduce your holdings. The lower portion of the chart is MACD that has generated a sell signal and the uptrend from 2011 has been roken. Many more months will be needed for XBI to be oversold and form a positive formation.
Don’t be surprised if technology is next to show weakness, now that biotechnology has broken down. Momentum patterns of technology (QQQ) have been deteriorating for a few months now (chart not shown). If more weakness in Nasdaq 100 (QQQ) occurs compared to the S&P 500 (SPY) additional bearish momentum warnings will be given.
Summing Up:
The market tape action is not improving. Daily swings up and down are increasing. It’s difficult to gage where the market will go hour by hour, day by day, but there is no question the trend of the market is down and risk is high. The leader of the bull market, Biotech, has now joined other averages breaking the uptrend from 2011. In this type of climate patience is recommended. Wait for our models to be more favorable signaling less risk, before chasing the market, in case there is more selling of stocks. For now I recommend being patient and treading lightly, because risk is too high. A safer opportunity will present itself in time but it’s not now!
I welcome you to call me with any comments, feedback or questions at 516.829.6444 or email bgortler@signalert.com.
*******Article in Systems and Forecasts February 04, 2015


