“The time of maximum pessimism is the best time to buy and the time of maximum optimism is the best time to sell.” —John Templeton (net worth $20 Billion)
August was a down month with increased market volatility. However, the decline stopped on August 28, with the S&P 500 (SPY) holding key daily support at 162.50 that I had mentioned in past newsletters with an intra-day low of 163.05. Investors were talking about how September could also be down, but instead prices reversed higher showing their muscles. International markets also picked up steam with emerging markets breaking the short term down trend. Market action now is favorable, with improved market internals suggesting prices will work their way higher.
Global markets are performing better which is promising for the US market.
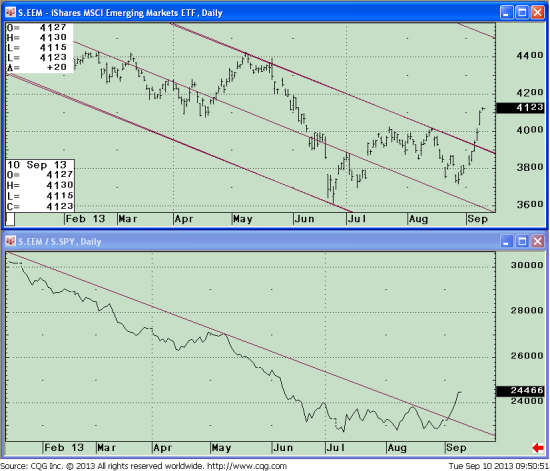
The iShares MSCI Emerging Markets Index ETF (EEM) daily chart has had some false breakouts to the upside earlier this year that ultimately failed. With recent trading action the EEM is showing a clear penetration through resistance giving higher upside projections to 44.50, the upper channel objective. (See top half of the chart to the right.)
In addition, notice the confirmation in relative strength demonstrated by the EEM/SPY ratio which is now rising and has broken the downward trend line from January which you can see in the bottom half of the chart.
Note: The weekly EEM chart (not shown) has also broken the downtrend, with improving MACD momentum patterns giving higher objectives. First resistance is at 42.60 where prices could stall. My bullish forecast would be negated if prices reverse down and fall below 37.25.
SPDR S&P 500 ETF Trust (SPY) Daily Chart
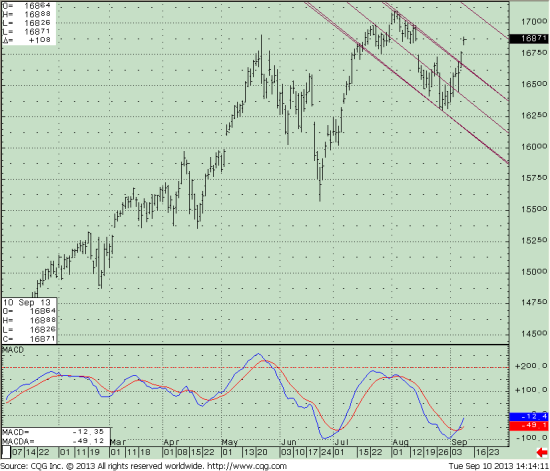
The daily chart of SPY to the right shows that the uptrend in the SPY from January is intact. The short term downtrend has been broken.
We once again are trading near the highs from earlier in the year. With the emerging markets moving higher I am expecting the S&P 500 to make a higher high. What is a little disturbing, however, is that the S&P 500 has lost some of its luster recently. MACD has turned up, but remains far from its July peak, setting up a potential negative divergence down the road. I will be watching to see if this loss of momentum continues as we move further into the month.
SPDR S&P 500 ETF Trust Weekly Chart
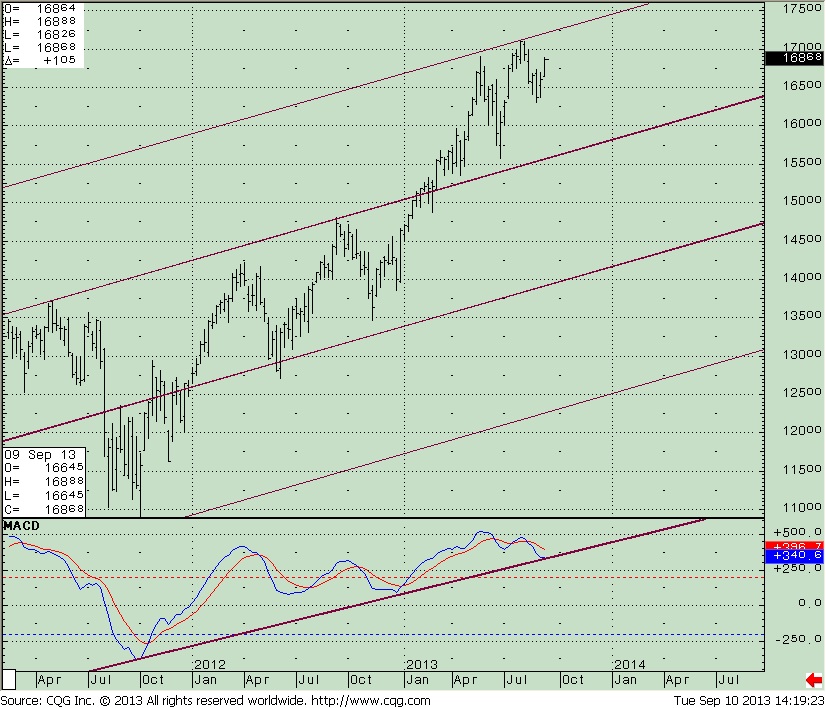
The S&P weekly MACD up-trend line from the October lows in 2012 is intact. (See the lower half of the chart to the left.) A turn up in MACD from here would be bullish. With the improving action in the overseas markets, along with market internals improving, I suspect the recent highs will be surpassed. However, it would be negative if prices stall, turn down and SPY trades below 155.00.
In Sum
The rally that initially lacked enthusiasm has broadened in scope. The technical indicators have improved, new lows are very low, volume patterns are positive, financials continuehigher, the Nasdaq is leading and now the internationals have joined in the rally. History suggests caution but the tape action is improving, suggesting the September surprise could be to the upside rather than the downside. I continue to give the market the benefit of the doubt as long as the weekly uptrends remain intact.
Feel free to contact me with your thoughts or comments at BGgortler@Signalert.com.
Sign up now to receive FREE REPORTS about investing
including “Market Outlook 2013” at Signalert.com
This is a hypothetical result and is not meant to represent the actual performance of any particular investment. Future results cannot be guaranteed.
Although the information is made with a sincere effort for accuracy, it is not guaranteed either in any form that the above information is a statement of fact, of opinion, or the result of following any of the recommendations made herein. Readers are encouraged to meet with their own advisors to consider the suitability of investments discussed above for their own particular situations and for determination of their own risk levels.
To discover how to achieve your financial dreams click here
Visit www.BGJourneyToWealth.com for more insights to growing your wealth!

Bonnie Gortler (@optiongirl) is a successful stock market guru who is passionate about teaching others about social media, weight loss and wealth. Over her 30-year corporate career, she has been instrumental in managing multi-million dollar client portfolios within a top rated investment firm. Bonnie is a uniquely multi-talented woman who believes that honesty, loyalty and perseverance are the keys to success. You will constantly find her displaying these beliefs due to her winning spirit and ‘You Can Do It’ attitude. Bonnie is a huge sports fan that has successfully lost over 70 pounds by applying the many lessons learned through her ongoing commitment toward personal growth and development while continually encouraging others to reach their goals & dreams. It is within her latest book project, “Journey to Wealth”, where Bonnie has made it her mission to help everyone learn the steps needed to gain sustainable wealth and personal prosperity. Order your copy of ”Journey to Wealth” today!
- Subscribe to BonnieGortler.com
- Connect with Bonnie via LinkedIn, Twitter & Facebook
- Put a smile on someone’s face and Send a card on Bonnie!
- Choose your very own FREE down-loadable gift by visiting bit.ly/bgoffers
Like this post? Feel free to use it in your blog or ezine as long as you use the above signature in its entirety


