Equity market overview – The bulls remain in control for now
The stock market continues its winning ways. In 2017, any decline that has occurred has been contained to only a few percent because the bulls quickly stepped in to buy and the market rebounded. Major averages are at or near their all-time highs. The New York Stock Exchange Index cumulative advance decline line has likewise made a new all-time high. Overseas markets are rising, especially emerging markets. The transportation average recently confirmed the Dow Jones high. (However, the Transports have pulled back this week. The significance of this divergence from the Industrials is unclear at this early stage.) VIX, a measure of fear, is at 9.79 on 07/18/17, historically a very low level. All of these factors are supporting our market. At this time only a few warning signs exist, such as unfavorable seasonality and some weakening momentum patterns appearing on some of the intermediate and long term charts.
The positives far outweigh the few warning signs that don’t seem to be deterring the bulls from moving the market higher. There is no evidence of a change in the prevailing uptrend. Our U.S. equity models remain overall neutral-bullish suggesting higher prices are likely over the next several months. Any pullback, if it were to occur is likely to be contained, rather than a larger decline of more than 20%.
ETF Corner
Let’s turn now away from US equities to review the position of Gold (GLD) since my article in the June 8, 2017 Systems and Forecasts newsletter “Gold Appears Ready to Shine”. As a reminder, you can trade gold bullion with the SPDR Gold Shares ETF (GLD). Purchasing the ETF (GLD) is an easy way to participate without holding the physical commodity. GLD tends to be trendy, once it establishes its direction.
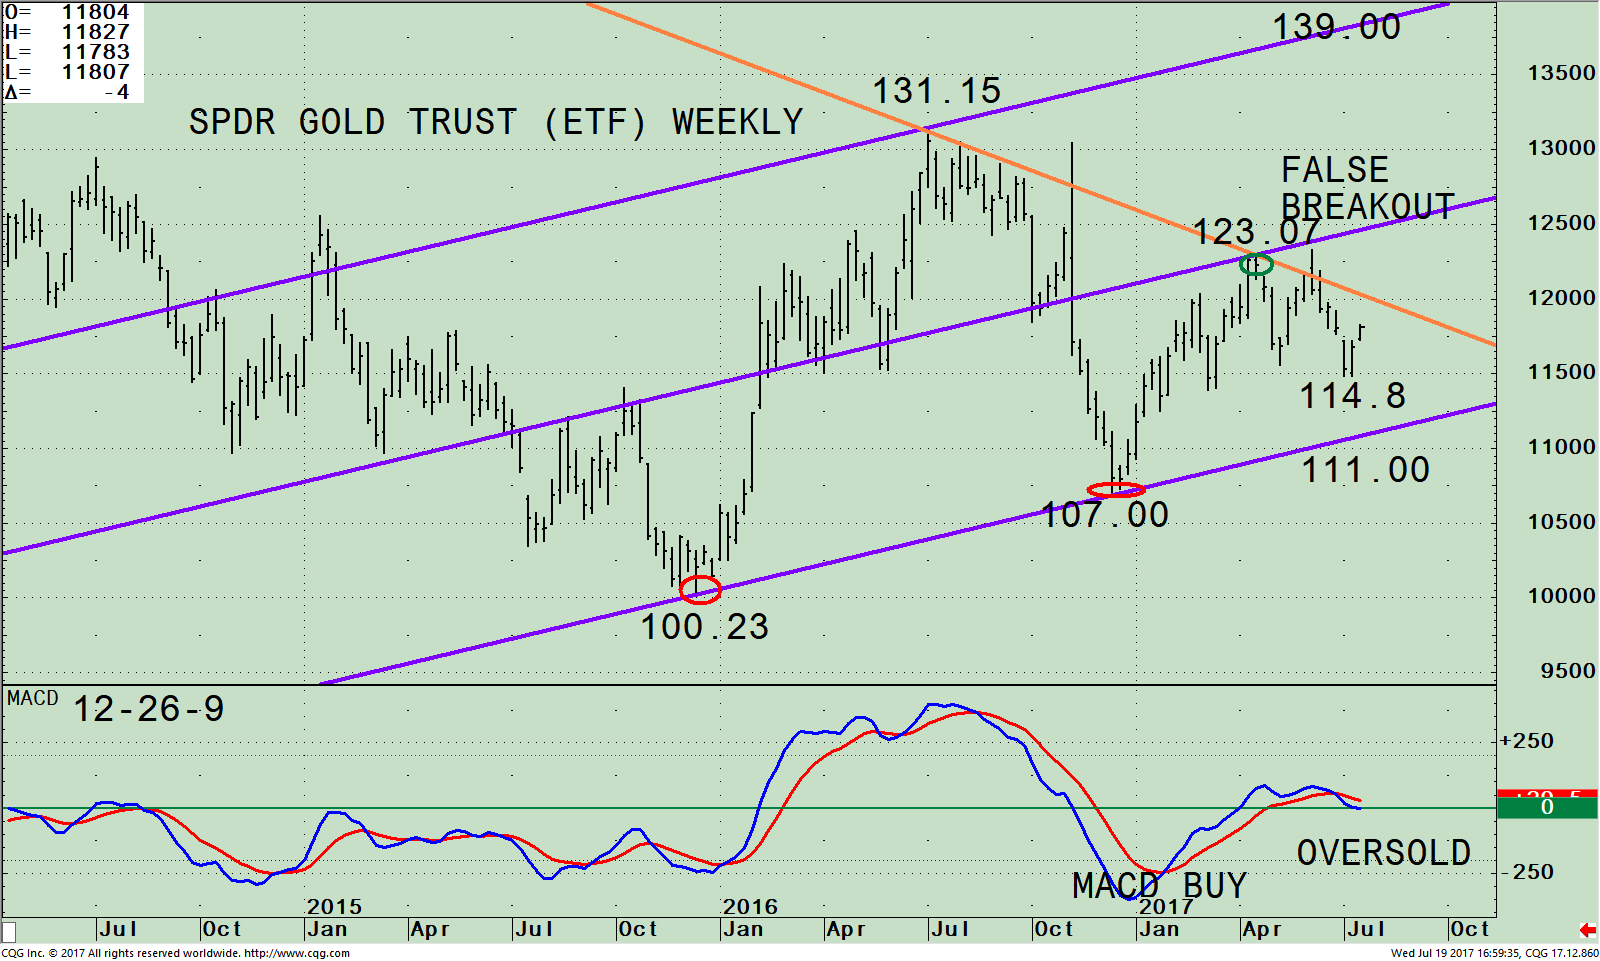
 The top portion of the GLD chart above shows the weekly active trend channel in effect (blue lines).
Gold (GLD) bottomed at 107.00 on 12/15/16. GLD penetrated the high on 04/17/17 at 123.07, slightly breaking the downtrend from its peak (orange line) on 07/05/16 , which appeared to be a breakout at the time. Instead, the breakout was false as GLD stalled at the middle channel, not powering through. GLD fell for five weeks to a low of 114.80 then turned up, holding well above the lower channel at 111.00 and above the low at 114.80. If GLD closes above the high at 123.07 (green circle) this time, GLD would likely be a true breakout. The potential upside target is 139.00. A close below the lower channel support at 111.00 would negate my bullish outlook.
The lower portion of the chart is the 12-26-9 MACD, a momentum indicator. MACD gave a buy from an extreme oversold condition as GLD rose. On the latest pullback MACD penetrated 0 and has now turned slightly below 0. Any short term rise in price now would turn MACD up and form a positive double bottom formation. This would imply further gains over the intermediate term (weeks-months).
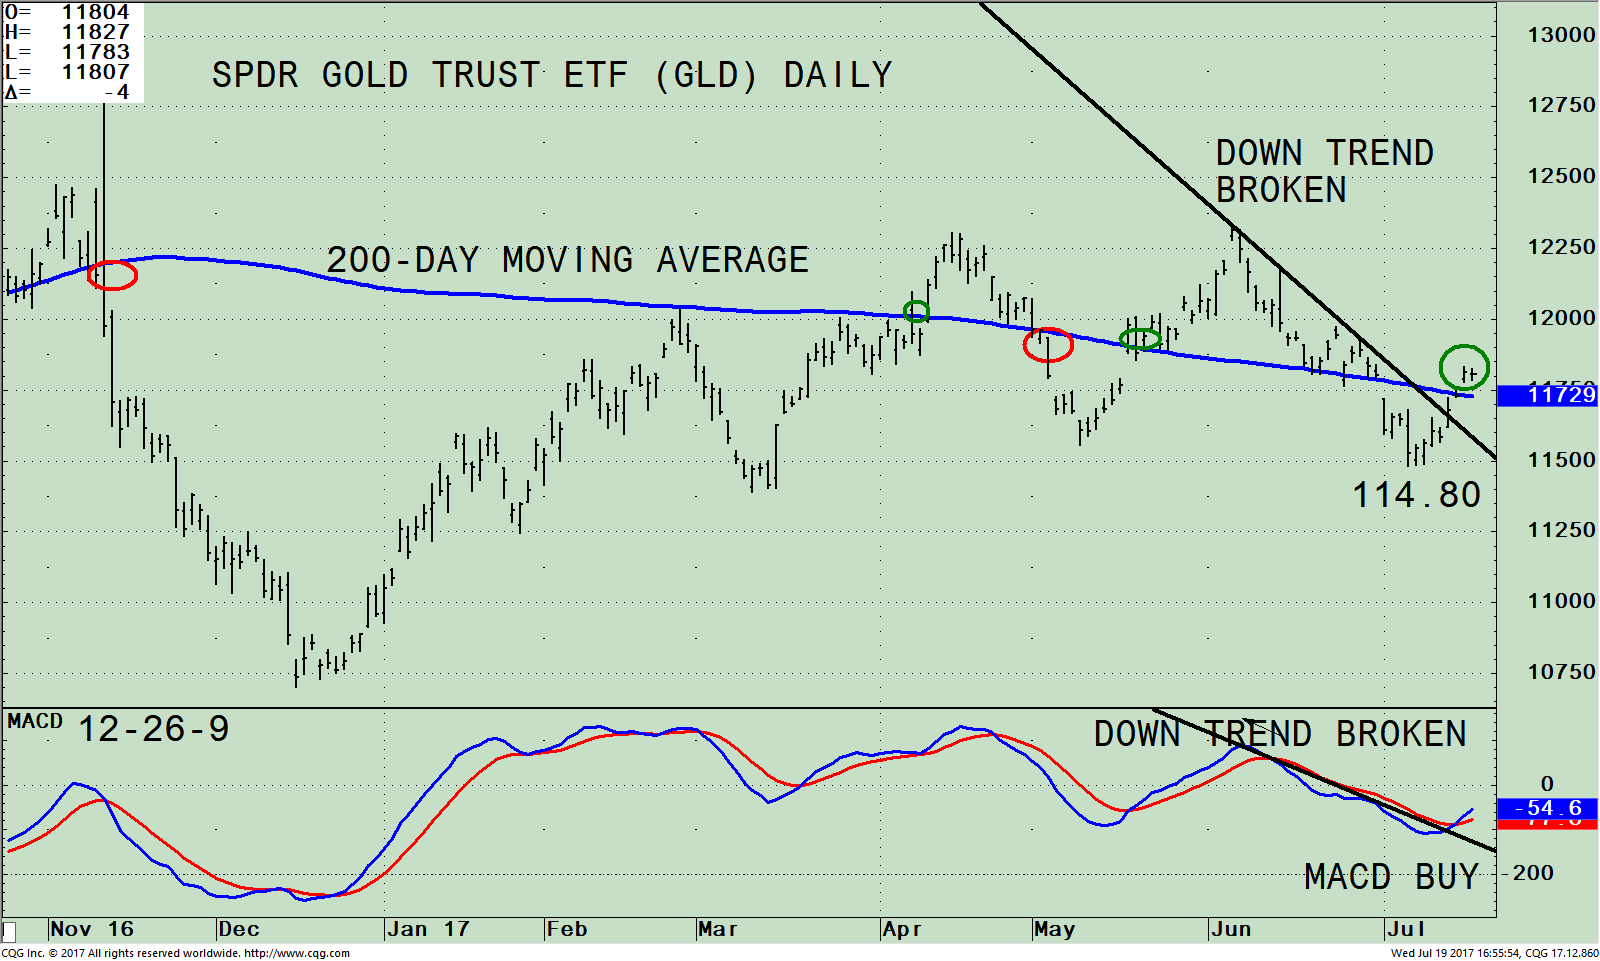
SPDR GOLD TRUST ETF (GLD) Daily and 12-26-9 MACD
 The top portion of the GLD chart above is the daily price with a 200-Day Simple Moving Average (blue line). The 200-day moving average is a common technical indicator which investors use to evaluate the price trend. Very simply put, it’s the average of GLD closing price over the last 200 days. If the price of the security is above the moving average it’s bullish (green circles). If the price is below the moving average, it’s bearish (red circles). Notice how on 07/18/17 GLD is above its 200-day moving average. In addition, Gold (GLD) has penetrated the down trend (black line) suggesting further gains are likely in the near term.
The lower portion of the chart is the 12-26-9 MACD, a momentum indicator. MACD has generated a fresh buy together with a downside trend line break. This is a favorable development for GLD.
In Sum:
U.S. equities continue their winning ways with the bulls remaining in control until proven otherwise. Our U.S. equity models remain overall neutral-bullish suggesting higher prices are likely over the next several months. Another buying opportunity for the gold bullion ETF (GLD) is here. Gold (GLD) is above its 200-day simple moving average and has successfully tested it weekly low. As long as Gold (GLD) is above 111.00, look for Gold (GLD) to trend higher.
I would love to hear from you. Please call 516-829-6444 or email at bgortler@signalert.com to share your thoughts or ask me any questions you might have.
*******Article published by Bonnie Gortler in Systems and Forecasts July 20, 2017

If you like this article, then you will love this!
Free Instant Access to Grow
Your Wealth and Well-Being E-Book HERE
Disclaimer: Although the information is made with a sincere effort for accuracy, it is not guaranteed that the information provided is a statement of fact. Nor can we guarantee the results of following any of the recommendations made herein. Readers are encouraged to meet with their own advisors to consider the suitability of investments for their own particular situations and for determination of their own risk levels. Past performance does not guarantee any future results


