A Bumpy Risky Ride In the Near Term For Technology Stocks May Be Ahead
When was the last time your investment advisor or you hae reviewed your portfolio? Have you noticed the wider intraday fluctuations in the major averages? The quiet days of the major averages moving less than ½ of a percent appear to be over. There are wider swings in the movement of stocks and the market averages each day. Volatility in the U.S. and international markets has started to pick up.
The good news is our stock market models indicate a positive market climate. Also favorable seasonality remains supporting the stock market, along with the intermediate and long-term trend being up. However, a bumpier ride may be in store for the next several weeks.
A shift out of technology appears underway.
Technology stocks have been much more volatile as of late. The selling pressure started before the news that the Senate would approve the tax bill, and further intermittent selling has continued since the bill passed. Investors have recently rotated into telecommunications stocks, consumer discretionary, staples, financials, and industrials after the approval of the tax bill. The shift out of technology may be only temporary, but I believe risk has increased substantially in the technology sector since the beginning of the year.
I recommend reducing your technology exposure if you are heavily invested. The Nasdaq relative strength is now weaker than the S&P 500 and is losing momentum. This could be a warning of a possible short-term pullback in technology that could carry through to the overall market. In addition this could affect other sectors that are also extended in the near term. It’s a good idea to keep an eye on the top holdings in the Nasdaq 100 (QQQ), to confirm the shift away from the technology sector. It’s a little early to tell if it’s profit-taking or the start of a larger move lower.

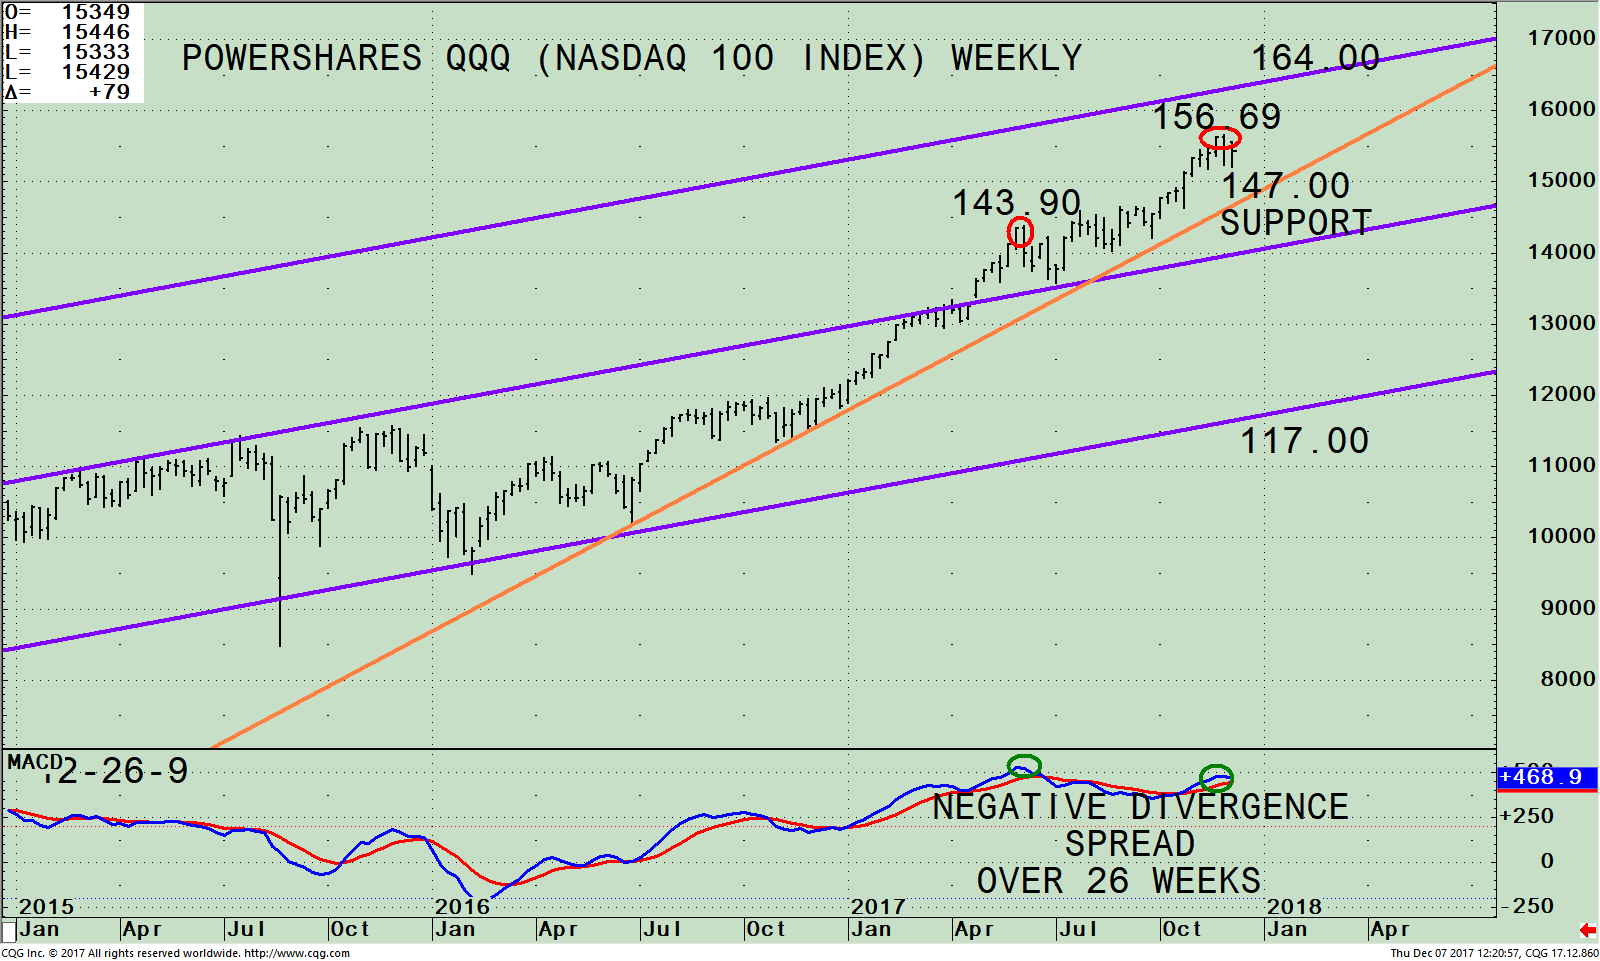
Figure: PowerShares QQQ ETF (Nasdaq 100 Index) Weekly Price and Trend Channels (Top), and MACD 12-26-9 (Bottom)
The top part of the chart shows the daily Power Shares 100 (QQQ), an exchange-traded fund based on the Nasdaq 100 Index, and its operative trend channel (purple line). The QQQ includes 100 of the largest domestic and international nonfinancial companies listed on the Nasdaq. As of 12/5/17, Apple, (AAPL) is the largest holding comprising 12.19%, Microsoft Corp (MSFT) 8.75%, Amazon.com, Inc. (AMZN) 7.63%, Facebook, Inc. Class A (FB) 5.70%, Alphabet Inc. Class C (GOOG) 4.86%, and Alphabet Inc. Class A (GOOGL), 4.23 % totaling 43.36%.
The technology sector has been one of the strongest areas of the stock market this year. The QQQ has made new highs with only a few small pullbacks along the way. The declines were sharp, but never broke the uptrend and were able to recover to new highs. This time could be different. If investors continue to rotate out of technology, the selling pressure will be magnified and money may flow into other sectors of the market. If this indeed is the case, a sign would be if the QQQ weakens during the late afternoon trading hours especially in the last hour of trading.
The intermediate price trend remains up as long as the QQQ is above its uptrend line (orange).
Support is at 147.00 and the upside channel objective is at 164.00. If the QQQ falls below support at 147.00 on a weekly close, the intermediate trend would change from up to down, implying weakness potentially to the middle channel at 140.00 followed by the lower channel at 117.00.
The bottom half of the chart is MACD (12, 26, 9), a measure of momentum. In June, MACD made a high. The difference between now and June is MACD not confirming the price high made in QQQ. The negative divergence is spread over 26 weeks. Time is no longer on the side of the bulls.
On the other hand, MACD has not yet generated a sell, so it’s still possible for MACD to turn up and move higher to confirm the QQQ high. I am recommending lightening up on technology stocks now. If you are overly invested in technology stocks, lock in some of your profits before a decline occurs. An old adage I have learned over my 35+ years “You Never Go Broke Taking a Profit”. If you do decide to wait, I recommend keeping an eye on the top holdings in the QQQ. If they start weakening again, have a plan ready in case further selling pressure occurs.
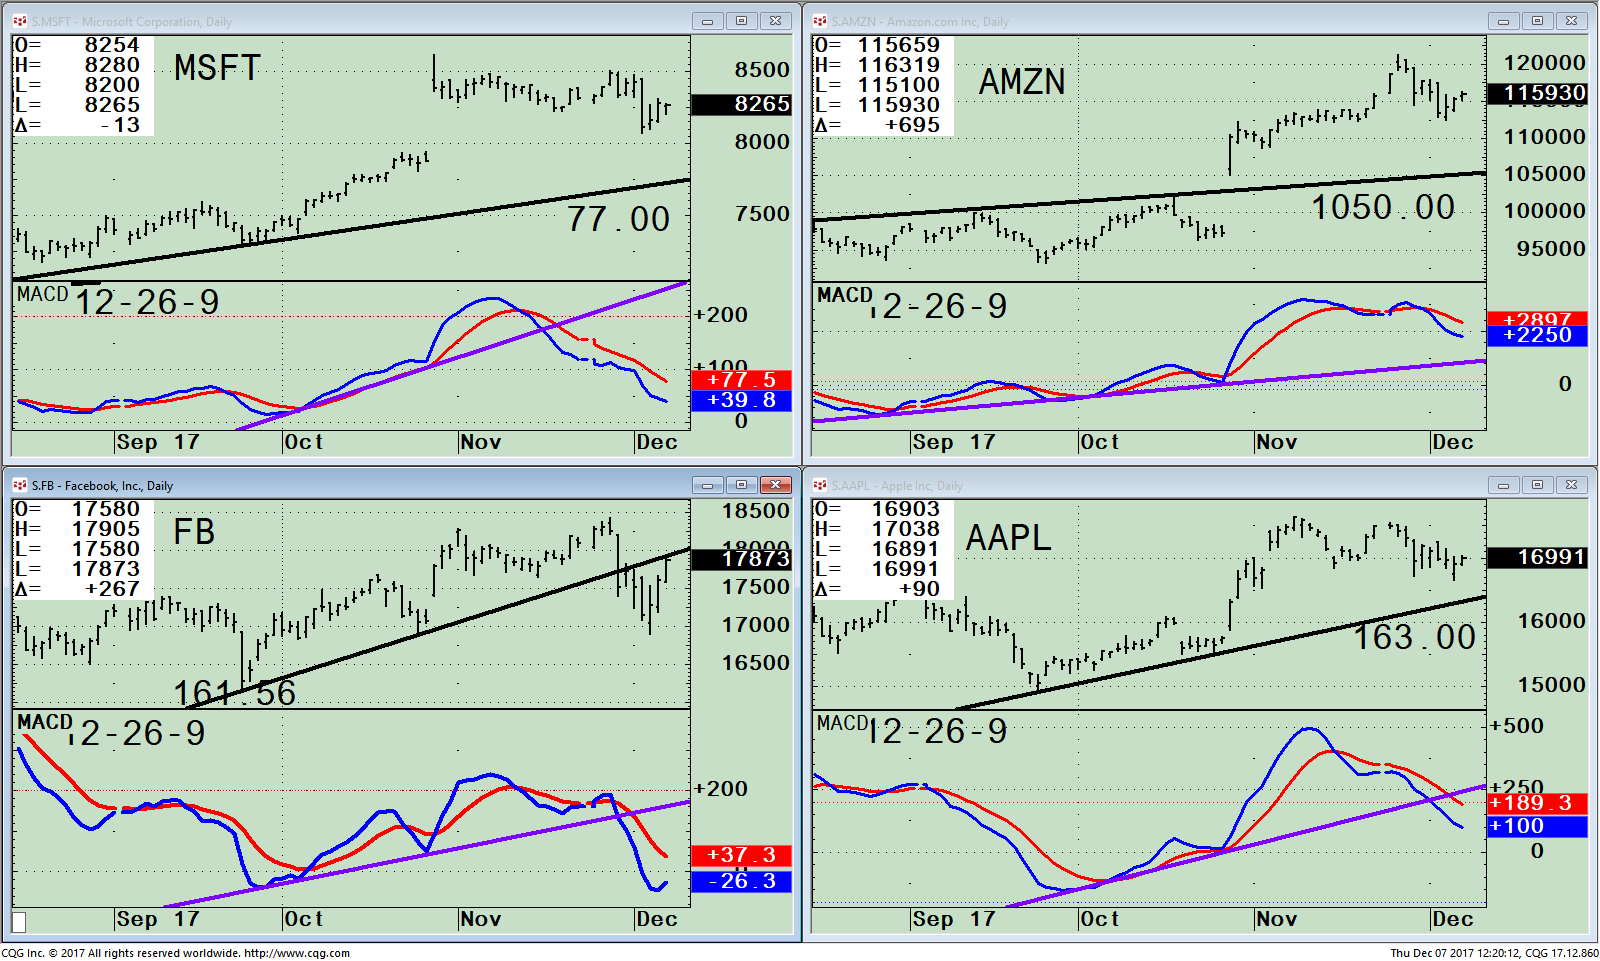
Figure: Daily Price of Microsoft (MSFT), Amazon (AMZN), Facebook, (FB) Apple (AAPL), and 12-26-9 MACD

In the past few trading sessions, technology stocks have been under some selling pressure. Uptrends are in effect for Microsoft (MSFT), and Apple (AAPL). Since November daily MACD patterns on all of these stocks are weakening, a warning sign a decline may be imminent. MACD is not yet oversold, below 0, or in a favorable position to support an extended rise. MACD uptrends (purple lines) have been broken in Microsoft (MSFT), Apple (AAPL) and Facebook, (FB). Only the MACD uptrend in Amazon (AMZN) remains in effect.
If the top holdings in the QQQ continue to weaken, further gains for the overall market could be jeopardized in the short-term. For aggressive investors and traders, here are some key levels of guidance.
Microsoft (MSFT) filled its gap from October and has risen the past two days. Further decline would not be a good sign. Support is at 77.00 followed by 72.00. Resistance is at 88.00.
Facebook (FB), has the most disturbing pattern of the group. FB broke its daily price uptrend this past week. What is different now? The weekly uptrend (not shown) has also been violated. Therefore, the short and intermediate term is now down. In addition, MACD is now on a sell with a negative divergence in place. The risk is higher than at any time this year based on the charts. During the recent quiet market environment where pullbacks have been contained, investors have been profitable buying quickly into weakness. Now selling strength could be a better strategy. Resistance is 179.50 followed by 184.00. Support is at 165.00, followed by 161.00.
Amazon (AMZN) peaked in late November, also under some selling pressure, but its chart pattern is more constructive because it remains above its breakout level in October. Resistance is the old highs at 1003.00 followed by 1029.00. Support is at 1108.00 followed by 1012.00.
Apple (AAPL) made a new all-time high on November 8 at 176.24. Apple (AAPL has pulled back in a quiet decline but remains in an uptrend. Support is at 163.00. Resistance is at 175.50. Many times Apple is a leader in the technology sector. A break through resistance would imply potential to 185.00. If this were to occur it could boost the entire sector.
Summing Up:
The market as a whole has been extremely resilient. The daily range of the major averages has widened, suggesting volatility could pick up, with an increase in risk compared to earlier in the year. Weakening momentum patterns are clear and spread over time which normally doesn’t work out well. However, 2017 is not an ordinary market; it’s one that is defying the odds. The short-term and intermediate-trend remain up for now. If you are overly invested in technology stocks, I recommend you lock in some of your profits before a full-fledged decline occurs. If the QQQ falls below support at 147.00 on a weekly close, the intermediate trend would change from up to down, implying weakness sooner rather than later.
I would like to wish you and your family a happy holiday season full of joy, health, and prosperity.
I would love to hear from you. Please call me at 516-829-6444 or email at bgortler@signalert.com to share your thoughts or ask me any questions you might have.
Sign up for a FREE 3 issue trial of Click Here: The Systems & Forecasts Newsletter
*******Article published by Bonnie Gortler in Systems and Forecasts December 07, 2017
Disclaimer: Although the information is made with a sincere effort for accuracy, it is not guaranteed that the information provided is a statement of fact. Nor can we guarantee the results of following any of the recommendations made herein. Readers are encouraged to meet with their own advisors to consider the suitability of investments for their own particular situations and for determination of their own risk levels. Past performance does not guarantee any future results.


