

Bonnie’s Market Update 3/28/25
03/30/2025
Once again the S&P 500 Index is trading toward its upper range and near its all-time highs for the year. This could finally be the time that advance in the S&P 500 continues instead of failing to follow through. Market breadth has improved in recent weeks. Small caps (IWM) are strong, making new highs for the year while technology and biotechnology have stabilized even though momentum has weakened.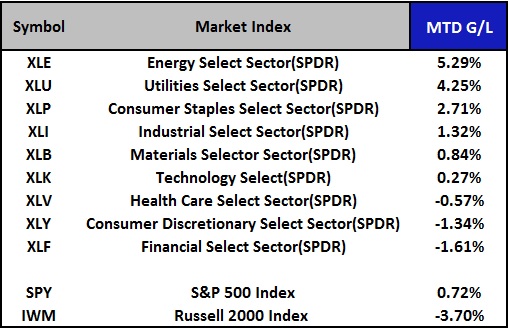
Investors’ appetite for representation in international markets is increasing, not only in Europe and Asia, but now emerging markets have joined the advance. As of 04/15/15, (see the table), the time of this writing, Russia (RSX), China (FXI), Brazil (EWZ), and Korea (EWY) are all up at least triple the S&P 500 (SPY). Even with the threat of interest rates rising, which is not normally bullish for emerging markets, it appears investors are giving more attention to this area.
There is a potential major shift in relative strength that favors emerging markets over US equities taking place. After being out of favor for years, peaking in 2007, a secondary peak in 2011 and a lower high in September 2014, the emerging markets area is showing signs of life. Europe formed favorable momentum patterns earlier this year, mentioned in the 1/23/15 newsletter, supporting the US market. Now emerging markets will provide an additional source of upward pull on stocks from outside the U.S.
What Are The Charts Saying Now? Weekly- iShares MSCI Emerging Markets (EEM) and Ratio EEM/SPY (Bottom)
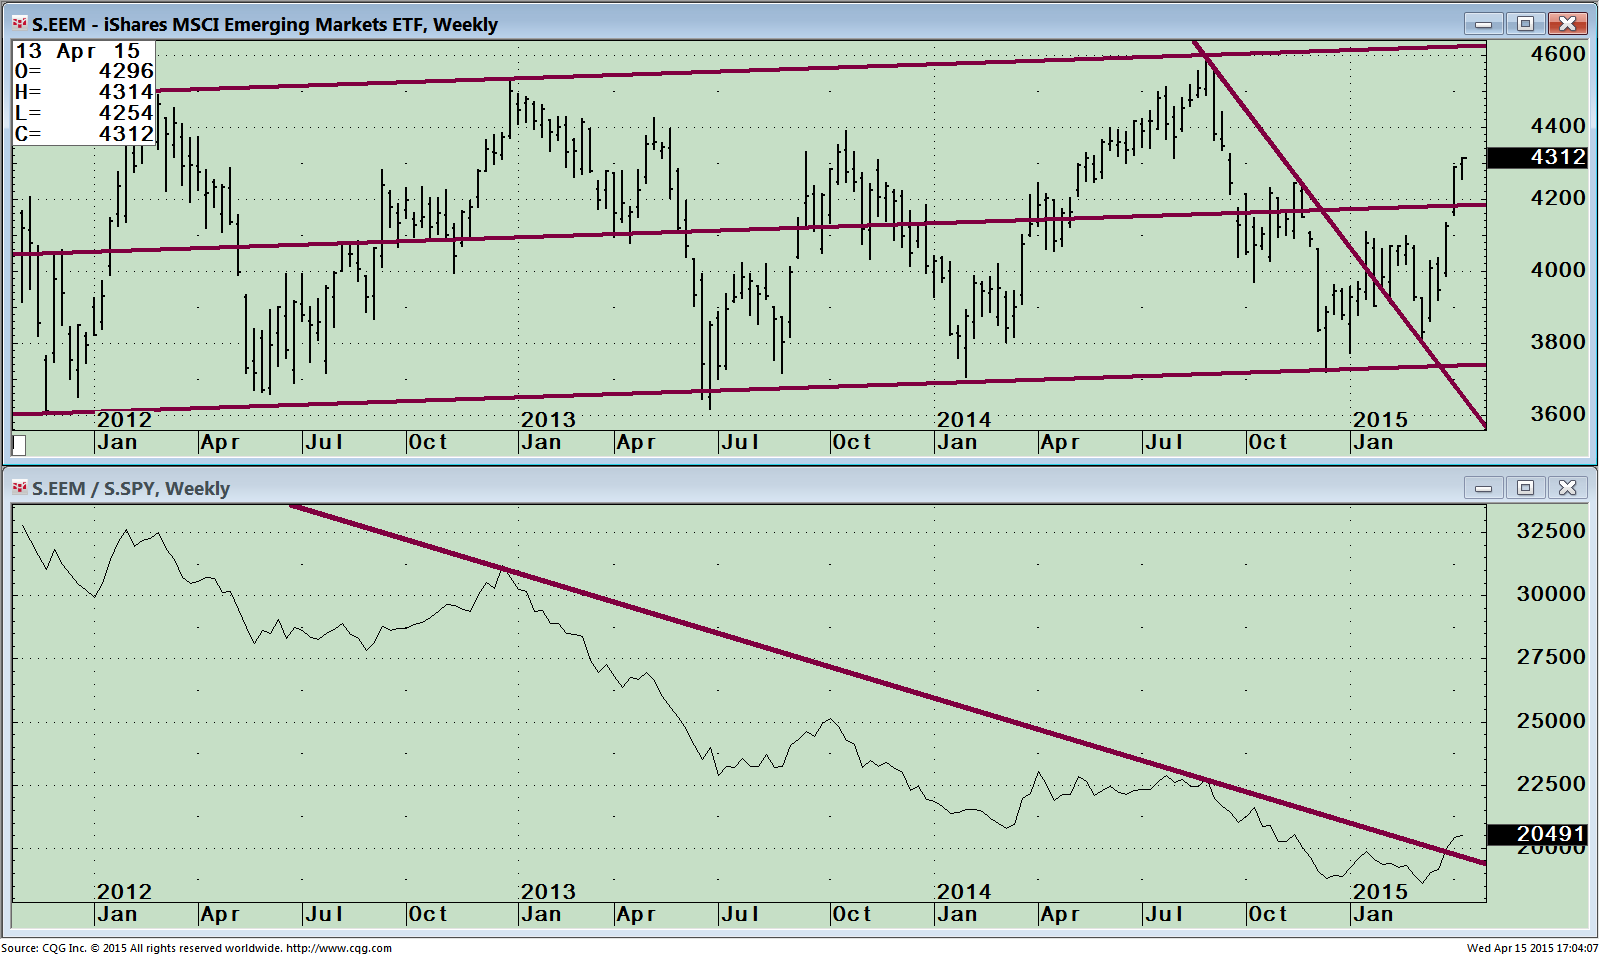
The top portion of the chart shows the weekly iShares MSCI Emerging Markets ETF (EEM) that gives you exposure to large and mid-cap emerging market equities. The top five country holdings as of 04/13/2015 is China 24.75%, Korea,(South) 14.47, Taiwan 12.25%, South Africa 7.69%, and Brazil 7.41%. EEM peaked at 44.99 on 12/31/2012 and then fell to a low of 34.16 on 06/24/13, down 24.1%. The market then traded in a wide range with the EEM unable to penetrate the highs after reaching the upper channel on 09/02/14. EEM then stalled, unable to get through the resistance and fell to a low of 37.19 on 12/15/14. EEM rose but required further base building and another test of the lows before this latest rally has started.
Notice the steep rise, the initial thrust is very strong up 8.4% from the low on 03/09/15. Most times when the thrust of an advance is very strong, prices will ultimately go higher especially after a successful test of an important low. Support is 42.00, an ideal buying opportunity if EEM pulls back, but it would be best if there is no pull back and price keeps rising straight up to the resistance at the upper channel, 46.00, another 6.5% higher. The lower part of the chart shows a comparison of relative strength between the price of EEM and S&P500. When the relative strength ratio EEM/SPY is rising it means EEM is stronger. Falling means the S&P 500 is stronger. Notice the rising line along with the clear break in the downtrend from December 2012. This is a very bullish development for Emerging Markets.
Weekly Relative Strength Ratio Between iShares MSCI Emerging Markets (EEM) and S&P 500 (SPY top), and RSI of this ratio (bottom)
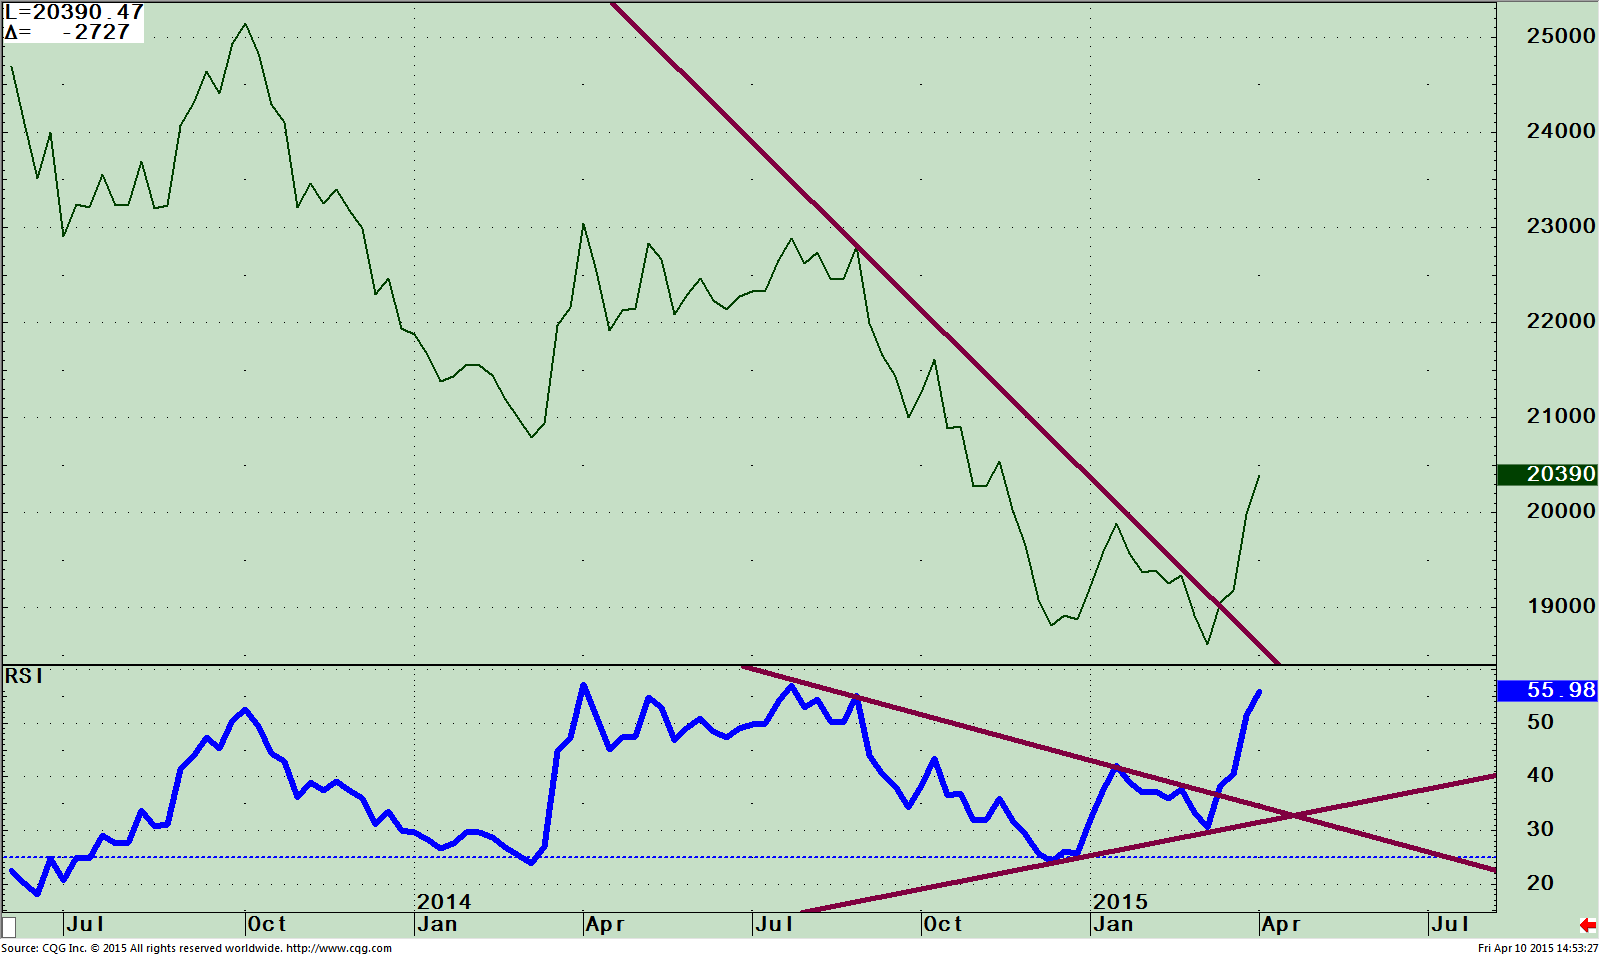
The relative strength ratio between two indices is one of my favorite tools to identify a significant change in leadership. The top chart is a closer look at the weekly EEM/SPY ratio that we saw in the bottom half of the previous chart. The down trend has been broken to the upside. EEM/SPY is rising confirming the change in trend where the EEM is stronger than the S&P 500, (line is rising) now leading in relative strength.
The lower half of chart shows the RSI of the EEM/SPY ratio, a very favorable rising double bottom pattern combined with a break in the down trend from July 2014, bullish.
(Note that “RSI” stands for the relative strength index, developed by Welles Wilder. This is not the same as the relative strength ratio. The relative strength index is an indicator based on just one set of price data. The relative strength ratio, EEM/SPY for example, compares the movements of two different securities.)
Monthly iShares MSCI Emerging Markets (EEM) and MACD (Middle and RSI (Bottom)
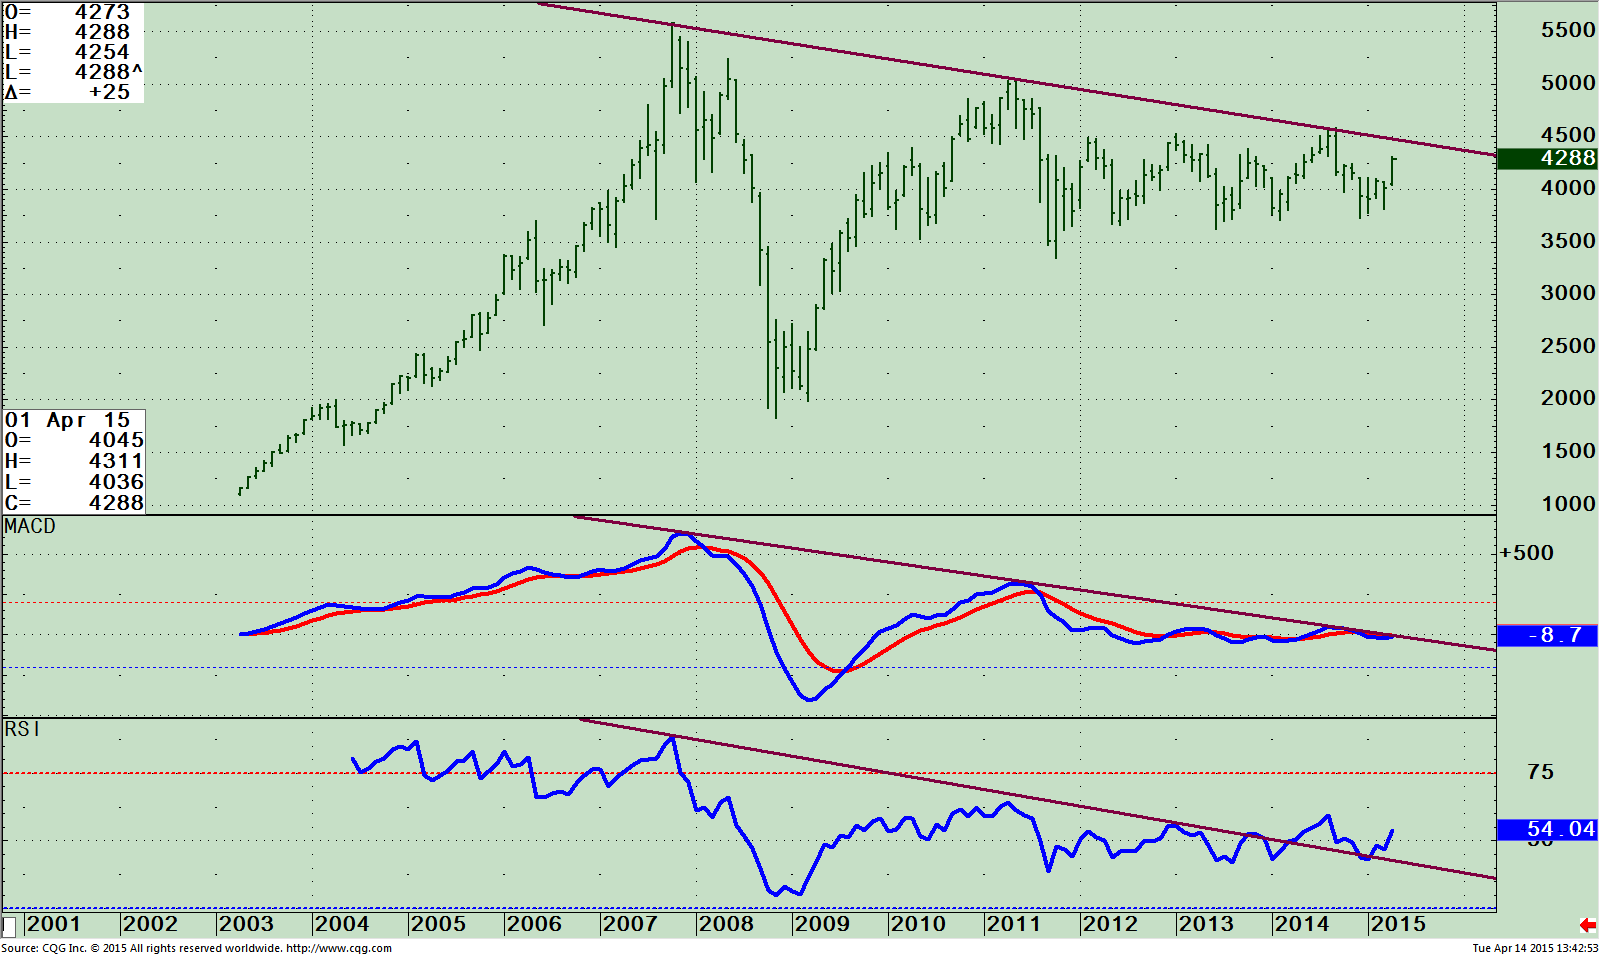
The top portion is the price of the monthly iShares MSCI Emerging Markets (EEM) ETF. A down trend has been in effect since the peak in October 2007. I am looking for investors to move money out of US and into the emerging market sector where there is a lot of value compared to the US equity market. The US market has been making new highs and is near the top of their channel with some sectors showing weakening momentum after huge price gains. A break above 45.00 would be bullish confirming the long term trend from down to up.
The middle chart, MACD, (a measure of momentum) of EEM also is close to breaking the long term down trend.
The bottom chart is technical indicator Relative Strength, RSI, that measures momentum. Notice in false breakout in 2014 and the retracement back to the down trendline, just like the pattern in the weekly price chart above, where prices tested the lows and then rallied sharply. In this case a double bottom has formed, momentum is gaining strength, and RSI is rising.
Just To Sum Up:
The major averages of the US market are trading toward the top of their ranges either near their recent highs or just under resistance. Emerging markets have been extremely good performers this month and technical momentum indicators are improving for the intermediate term and the long term trend is close to also confirming. There is a very good chance emerging markets will be the next major opportunity to make profits and potentially be the fuel to lead the US stock market higher. Investors’ enthusiasm for representation in international markets is increasing. With emerging markets now showing strength and joining the advance, it’s a good time to diversify your holding and add to your investments in emerging markets.
I invite you to share your stock market insights, questions or comments by calling me at 1-844-829-6229 or Email
me at bgortler@signalert.com.


Create more wealth in your life
with these simple strategies.
As an added bonus you will also
receive BG’s Updates and Ezine

Discover how to quickly create more well-being in your life with these simple strategies.
As an added bonus you will also
receive BG’s Updates and Ezine

As an added bonus you will receive BG’s Updates and Ezine

All work listed on BonnieGortler.com is licensed under a Creative Commons Attribution - Noncommercial - No Derivative Works 3.0 Unported License.
