

Bonnie’s Market Update 3/28/25
03/30/2025
“Bull markets are born on pessimism, grow on skepticism,
mature on optimism, and die on euphoria” –Sir John Templeton
Volume has been light with traders and investors taking time off during the summer. We are entering into September, historically the weakest month of the year. Since our last newsletter the S&P 500 SPDR (SPY) fell, but held the 162.50 level. A short-term bounce followed from August 20-26, but that failed to take out the August 2high of 170.97. The risk of a breakdown to below 162.50 is increasing.
A negative divergence in the weekly SPY chart still looms, so don’t be complacent.
The S&P 500 (SPY) stalled without getting through the top channel in the weekly chart (below). There is a clear negative divergence (which is potentially bearish): a higher high in price but a lower high in MACD momentum.
The good news is that the up-trend 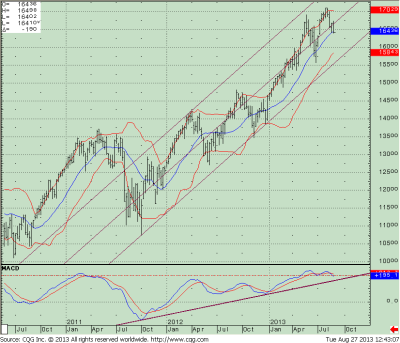
line in MACD from the beginning
of the year connecting the October
lows in 2012 as shown on the chart
is intact. As long as this key weekly
trend line is not broken and prices
hold above 155, I will continue to give the market the benefit of the doubt.
Of course, I would prefer if the 162.50 short term support (interred from daily SPY charts) holds and we do not fall to 155. Either way, I believe declines will stay contained for now even though volatility has increased in the past two weeks. However, if SPY breaks down to below 155, the next lower channel will give a downside objective to 132.50.
Figure (right): S&P 500 SPDR (SPY)
weekly (top) and 12-26 week MACD
(bottom)
Small-caps are doing better than the S&P 500
The iShares Russell 2000 Index ETF (IWM) is clearly stronger than the S&P 500 SPDR. Unlike the S&P 500 SPDR, IWM did get through the top channel before turning down. Also, there is no negative divergence in IWM and we are well above the middle channel. (See chart on page 3.) However, on the big down day (August 27), IWM fell 2.35%, compared to the 1.59% loss in SPY. If traders turn more bearish and they become risk averse, small-caps ETFs as IWM will fall faster than large-caps such as SPY. On the other hand, if IWM outperforms SPY going forward, this would be positive for the market overall.
As long the 12-26 week MACD of IWM does not break its the weekly uptrend trend line from October, I believe this will be a positive for the market. The next lower support level for IWM is 97.50, followed by 92.50. I would consider it bearish going forward if 92.50 is broken.
Figure: IWM weekly (top) and 12- 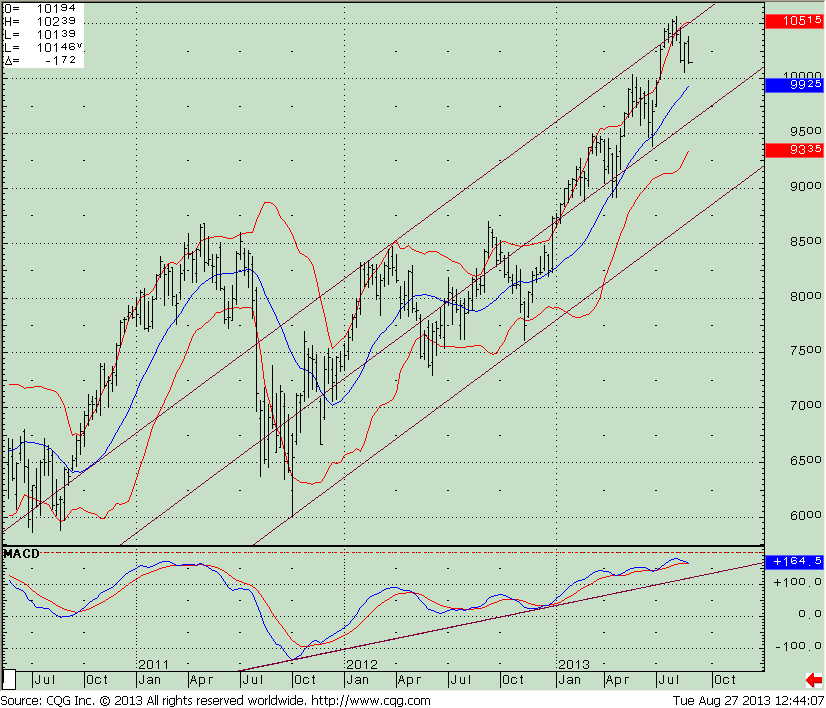
26 week MACD (bottom).
A comparison of this chart to the SPY weekly chart on page 2 shows IWM to be stronger for two reasons. First, there is no negative divergence here between price and MACD. Rather, both made new highs in early August.
Second, IWM penetrated the upper
channel in early August, which SPY was unable to do. Even though the intermediate-term trend has favored IWM over SPY, more recently, IWM has given back some relative strength. It would be bullish if IWM could resume leadership.
The market is giving different messages, depending on which sectors you are analyzing. Not all the news is worrisome. For example, some of the volume patterns I monitor have turned up from oversold conditions, which is a scenario in which tradable rallies have occurred in the past. The number of stocks on the NYSE that are making new 52-week lows is shrinking. And on the monthly chart of the S&P 500 Index, new highs in MACD are confirming new highs in price (unlike the weekly chart on page 2).
However, it is now more important to keep a watchful eye on your holdings. The following developments are potentially bearish. Pay attention to see if they continue:
• Emerging markets failed once again to lead the market higher and are no longer acting well
• High yield bonds have stabilized after recent losses but have not started rising. It would be bullish if prices were to rise.
• One of our trading models will no longer be favorable starting September 3.
In Sum
The market action has been split more, compared to earlier in the year when everything was advancing. The narrowing participation in the rallies is a warning sign and suggests caution. I am disappointed with the recent action, having expected the bounce to last longer than it did. The rally lacked enthusiasm among traders who sold their positions into rally. As a result, indexes failed to break through resistance levels. Investors are nervous about potential conflict in Syria, and talks of Fed tapering possibly during the next Fed’s meeting that is scheduledfor September 17 and 18. Lastly, September and October are near, which are historically weak months of the year.
As long as uptrends remain intact, I continue to give the market the benefi t of the doubt, but it is a good idea to continue to review your portfolio to make sure you can manage the risk if interest rates rise or the stock market volatility increases.
Please contact me with your thoughts or comments at bonnie@bonniegortler.com.
Sign up now to receive FREE REPORTS about investing
including “Market Outlook 2013” at Signalert.com
This material is not intended to be, nor should it be used as, financial, legal, tax or investment advice nor an opinion or recommendation by Signalert Asset Management (“Signalert”) regarding the appropriateness of any investment. This material does not take into account the particular investment objectives or financial circumstances of any specific client or type of client. Signalert’s products may not be suitable for all clients. No representation or guarantee is made that a client is likely to achieve his or her investment objectives through investing with Signalert, or will be profitable or will not sustain a loss. Past performance is not indicative of future results.
This is a hypothetical result and is not meant to represent the actual performance of any particular investment. Future results cannot be guaranteed.
Although the information is made with a sincere effort for accuracy, it is not guaranteed either in any form that the above information is a statement of fact, of opinion, or the result of following any of the recommendations made herein. Readers are encouraged to meet with their own advisors to consider the suitability of investments discussed above for their own particular situations and for determination of their own risk levels.
To discover how to achieve your financial dreams click here
Visit www.BGJourneyToWealth.com for more insights to growing your wealth!

Bonnie Gortler (@optiongirl) is a successful stock market guru who is passionate about teaching others about social media, weight loss and wealth. Over her 30-year corporate career, she has been instrumental in managing multi-million dollar client portfolios within a top rated investment firm. Bonnie is a uniquely multi-talented woman who believes that honesty, loyalty and perseverance are the keys to success. You will constantly find her displaying these beliefs due to her winning spirit and ‘You Can Do It’ attitude. Bonnie is a huge sports fan that has successfully lost over 70 pounds by applying the many lessons learned through her ongoing commitment toward personal growth and development while continually encouraging others to reach their goals & dreams. It is within her latest book project, “Journey to Wealth”, where Bonnie has made it her mission to help everyone learn the steps needed to gain sustainable wealth and personal prosperity. Order your copy of ”Journey to Wealth” today!
- Subscribe to BonnieGortler.com
- Connect with Bonnie via LinkedIn, Twitter & Facebook
- Put a smile on someone’s face and Send a card on Bonnie!
- Choose your very own FREE down-loadable gift by visiting bit.ly/bgoffers
Like this post? Feel free to use it in your blog or ezine as long as you use the above signature in its entirety


Create more wealth in your life
with these simple strategies.
As an added bonus you will also
receive BG’s Updates and Ezine

Discover how to quickly create more well-being in your life with these simple strategies.
As an added bonus you will also
receive BG’s Updates and Ezine

As an added bonus you will receive BG’s Updates and Ezine

All work listed on BonnieGortler.com is licensed under a Creative Commons Attribution - Noncommercial - No Derivative Works 3.0 Unported License.
