

Bonnie’s Market Update 3/28/25
03/30/2025
This year, holding securities instead of trading securities has mostly been profitable. We had a healthy rally in July in the S&P 500 after a short decline in June. As I stated in the July 19th newsletter, the pull back was over and charts suggested higher prices ahead. This was the case for many of the global markets and the Nasdaq. Apple led the way higher, penetrating 500 for the first time since January with a high of 504.25 on August 14th, which is a positive for the overall market.
The S&P 500 and the Russell 2000 Small Cap Index didn’t go higher recently, but there was no real selling pressure either as it went through a consolidation process. There has been almost a 10% gain in the S&P 500 SPDR (SPY) from June 24th lows of 155.73 to the high of 170.97 on August 2, a decent rally indeed. SPY remains near the highs, trading at 166 which is just 2.5% below its recent peak.
The key questions are: Will short term support hold? Will intermediate support hold? If not, how much of a decline might take place?
What does the S&P 500 SPDR (SPY) chart say now?
The daily chart of the S&P 500 SPDR (SPY) in the upper left hand corner shows that the last time a short termtrend was broken was on June 23, but prices reversed back up a day later. The S&P 500 (SPY) has now broken support once again when falling below 167 on August 15. The August 15 decline suggests the possibility of a further retracement to $162.50.
The S&P 500 (SPY) is no longer leading in relative strength. See the S&P/QQQ Ratio (Top Right) where the ratio is now declining.
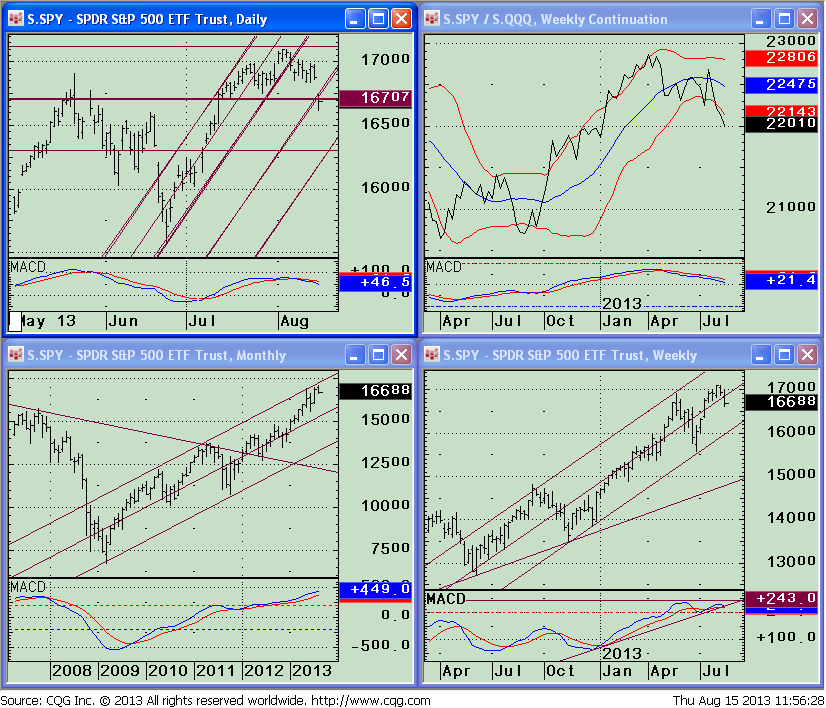
The S&P 500 (SPY) weekly chart (bottom right) appears to have stalled and has a clear negative divergence, with a higher high in pric but a lower high in (MACD) momentum.
The good news is the MACD trend line has not broken the up-trend line from the beginning of the year connecting the October lows in 2012 as shown on the chart. As long as this trend line holds above 162.50, I will continue to give the market the benefit of the doubt and expect prices to work higher even with the divergence since June.
Investing in Equities in 2013 has Been Rewarding but Will It Continue?
Only the monthly chart of the S&P 500 remains in a solid uptrend. The S&P 500 monthly chart is trading toward the top of its range (see bottom left of chart above) and the monthly MACD is also rising to new highs. The absence of a negative divergence is favorable.
Global markets have been acting better which is promising for the US market.
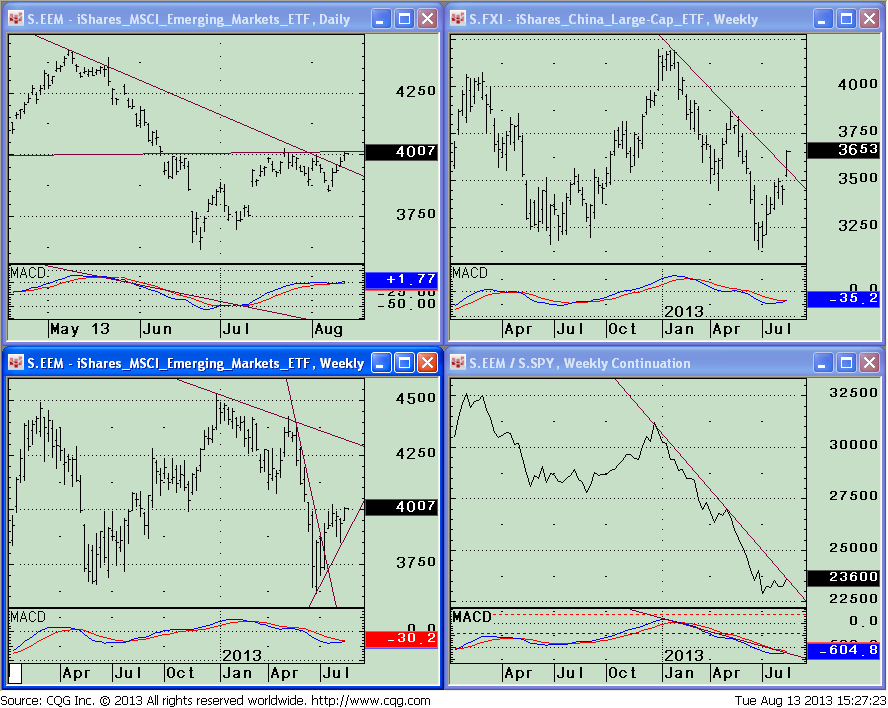
The Daily iShares MSCI Emerging Markets Index ETF (EEM) chart is at resistance (top left). A break above the horizontal line would suggest higher prices. The weekly chart (Bottom Left) has broken its downtrend, reversed down and has begun to rise again, bullish.
The S&P 500 is losing its relative strength. The EEM/SPY Ratio(Bottom Right) hasturned up and is very close to breaking its downtrend. If prices continue higher this would be a favorable development which could help our market continue higher. The FXI iShares FTSE/Xinhua China25 Index ETF has clearly broken its weekly downtrend. (See chart of FXI, top right)
Positive Observations
• The Dow Theory reconfirmed the bull market on 8/1/13, when the Dow-Jones Industrial Average and the Dow-Jones Transportation Average both closed at new price highs.
• The Nasdaq 100/S&P 500 Relative Strength Ratio (QQQ/SPY) has turned favorable and now at its
highest levels of the past 6 months on 8/8/13.
• The Nasdaq is now leading in relative strength which has been helped by Apple continuing to move higher.
• Small and Mid Caps are acting well in recent months and lead in relative strength over the S&P 500.
• In addition to emerging markets acting better, the iShares S&P Europe 350 Index ETF (IEV) broke its 2011 highs, the highest level since 2008.
Investing in Equities in 2013 has Been Rewarding but Will It Continue?
Negative Observations
• The Cumulative Daily Advance-Decline Line has not confirmed the recent highs in the market averages.
• Volume patterns that I monitor have turned down, no longer overbought, moving into oversold territory
from which rallies develop; however at this time they are still falling and have not turned up yet.
• Market breadth is not impressive as of late in recent sessions, with net declines expanding.
• New Highs were not increasing as the market climbed higher.
• New lows on the New York Stock Exchange Index (NYSE) have increased with readings over 200 rather than in single digits that would represent a confirmation of record high prices.
• High yield bonds stopped rising in recent weeks after firming in price.
• September and October are looming ahead, which are weak months historically.
In Sum
After four years of rising stock prices, it might be time for a market correction. I will be watching market action closely to determine if the recent decline is merely another short term correction or it could become more serious. For now I will continue to give the market the benefit of the doubt, anticipating that at worst the S&P 500 SPDR will retrace another 2.5% down to the $162.50 area. However, a breakdown to below this level would be worrisome.
Sign up now to receive FREE REPORTS about investing
including “Market Outlook 2013” at Signalert.com
This material is not intended to be, nor should it be used as, financial, legal, tax or investment advice nor an opinion or recommendation by Signalert Asset Management (“Signalert”) regarding the appropriateness of any investment. This material does not take into account the particular investment objectives or financial circumstances of any specific client or type of client. Signalert’s products may not be suitable for all clients. No representation or guarantee is made that a client is likely to achieve his or her investment objectives through investing with Signalert, or will be profitable or will not sustain a loss. Past performance is not indicative of future results.
This is a hypothetical result and is not meant to represent the actual performance of any particular investment. Future results cannot be guaranteed.
Although the information is made with a sincere effort for accuracy, it is not guaranteed either in any form that the above information is a statement of fact, of opinion, or the result of following any of the recommendations made herein. Readers are encouraged to meet with their own advisors to consider the suitability of investments discussed above for their own particular situations and for determination of their own risk levels.
Feel free to contact me with your thoughts or comments at bgortler at Signalert.com.
To discover how to achieve your financial dreams click here
Visit www.BGJourneyToWealth.com for more insights to growing your wealth!

Bonnie Gortler (@optiongirl) is a successful stock market guru who is passionate about teaching others about social media, weight loss and wealth. Over her 30-year corporate career, she has been instrumental in managing multi-million dollar client portfolios within a top rated investment firm. Bonnie is a uniquely multi-talented woman who believes that honesty, loyalty and perseverance are the keys to success. You will constantly find her displaying these beliefs due to her winning spirit and ‘You Can Do It’ attitude. Bonnie is a huge sports fan that has successfully lost over 70 pounds by applying the many lessons learned through her ongoing commitment toward personal growth and development while continually encouraging others to reach their goals & dreams. It is within her latest book project, “Journey to Wealth”, where Bonnie has made it her mission to help everyone learn the steps needed to gain sustainable wealth and personal prosperity. Order your copy of ”Journey to Wealth” today!
- Subscribe to BonnieGortler.com
- Connect with Bonnie via LinkedIn, Twitter & Facebook
- Put a smile on someone’s face and Send a card on Bonnie!
- Choose your very own FREE down-loadable gift by visiting bit.ly/bgoffers
Like this post? Feel free to use it in your blog or ezine as long as you use the above signature in its entirety


Create more wealth in your life
with these simple strategies.
As an added bonus you will also
receive BG’s Updates and Ezine

Discover how to quickly create more well-being in your life with these simple strategies.
As an added bonus you will also
receive BG’s Updates and Ezine

As an added bonus you will receive BG’s Updates and Ezine

All work listed on BonnieGortler.com is licensed under a Creative Commons Attribution - Noncommercial - No Derivative Works 3.0 Unported License.
