

Bonnie’s Market Update 3/28/25
03/30/2025
The bond and stock markets were under pressure after being spooked with talk that the Fed will be reducing its Quantitative Easing program, causing interest rates to rise, bond prices to fall and selling pressure in equities.Once again the stock market steadied itself before too long, with the S&P 500 holding support during the most recent decline of about 5%. Earlier this month the market got oversold, making a low just above 160 on the SPDR S&P 500 SPDR (SPY). The S&P 500 then rallied to1654; stopping slightly above the 1650 target mentioned in the June 7 newsletter after failing at the first attempt.
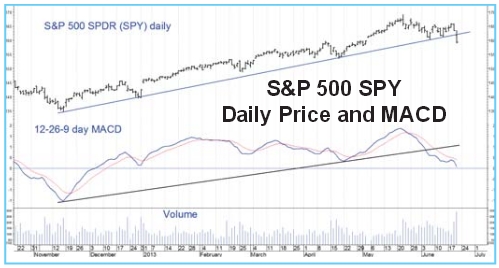 Before the Federal Reserve meeting on June 18-19, we were in the process of challenging the highs, after breaking a short term downtrend in price; however there has been some slippage in the market internals and technical damage which can be seen on the daily chart of the S&P 500 chart (right). Upside momentum based on both price and on MACD has clearly been violated. This suggests we probably will not have an above average rally from here. In general, momentum normally peaks before the market peaks.
I believe sell stops are waiting below 160 which will likely cause downside selling pressure to the152-153 zone. For aggressive traders, this support level would be a good buying opportunity.
What Are The Positives For Continued Stock Market Strength?
 The monthly uptrend remains in effect from the 2009 lows on the S&P 500 (SPY) trading well above the breakout from January of this year.
What Are The Negatives for Concern For a Decline From Here?
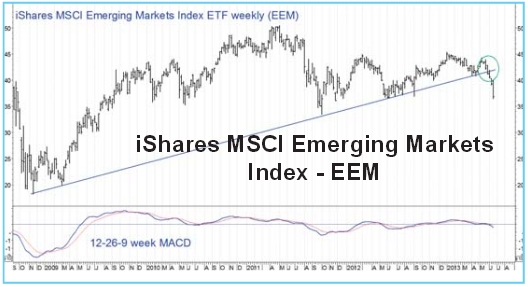 Emerging Market iShares (EEM) are acting very poorly, one of the weakest areas of the market falling to the lowest level in nine months. It has also broken a support line extending back to the low of 2008, a very big concern. (See chart at right, with trendline break circled in green.) This is not an area that I would be bottom fishing at this time.It’s best to wait for a more favorable pattern in MACD to develop. The price action since October 2011 implies a downside objective of 33.50.
In sum, to date decline in the S&P 500 has been contained but there is a good chance the short term top could have occurred. If declines continue around the world, profit taking might upset the US markets more than it has so far. Further market declines would give us an opportunity to take advantage of prices of securities that are good quality and good value. Look for higher volatility as we move further into the summer months.
I am looking for a pullback. However, the intermediate and longer term charts on the S&P 500 are still in an uptrend which most likely will support the market. In addition our long term models remain on a buy so I will give the market the benefit of the doubt. If the market breaks 159 on the S&P 500 SPDR (SPY) I would expect to see a short term correction to the 153-155 zone. (SPY paid a $0.84 dividend on 6/21, so the former 160 support level is downwardly adjusted to 159.) As of the morning of 6/21, SPY is teetering around this level. I do advise you to continue to review your portfolio and evaluate the risk vs. the reward on your investment.
You may print or download article here
This material is not intended to be, nor should it be used as, financial, legal, tax or investment advice nor an opinion or recommendation by Signalert Asset Management (“Signalert”) regarding the appropriateness of any investment. This material does not take into account the particular investment objectives or financial circumstances of any specific client or type of client. Signalert’s products may not be suitable for all clients. No representation or guarantee is made that a client is likely to achieve his or her investment objectives through investing with Signalert, or will be profitable or will not sustain a loss. Past performance is not indicative of future results.
Sign up now to receive FREE REPORTS about investing
including “Market Outlook 2013” at Signalert.com
To discover how to achieve your financial dreams click here
Visit www.BGJourneyToWealth.com for more insights to growing your wealth!

Bonnie Gortler (@optiongirl) is a successful stock market guru who is passionate about teaching others about social media, weight loss and wealth. Over her 30-year corporate career, she has been instrumental in managing multi-million dollar client portfolios within a top rated investment firm. Bonnie is a uniquely multi-talented woman who believes that honesty, loyalty and perseverance are the keys to success. You will constantly find her displaying these beliefs due to her winning spirit and ‘You Can Do It’ attitude. Bonnie is a huge sports fan that has successfully lost over 70 pounds by applying the many lessons learned through her ongoing commitment toward personal growth and development while continually encouraging others to reach their goals & dreams. It is within her latest book project, “Journey to Wealth”, where Bonnie has made it her mission to help everyone learn the steps needed to gain sustainable wealth and personal prosperity. Order your copy of ”Journey to Wealth” today!
- Subscribe to BonnieGortler.com
- Connect with Bonnie via LinkedIn, Twitter & Facebook
- Put a smile on someone’s face and Send a card on Bonnie!
- Choose your very own FREE down-loadable gift by visiting bit.ly/bgoffers
Like this post? Feel free to use it in your blog or ezine as long as you use the above signature in its entirety


Create more wealth in your life
with these simple strategies.
As an added bonus you will also
receive BG’s Updates and Ezine

Discover how to quickly create more well-being in your life with these simple strategies.
As an added bonus you will also
receive BG’s Updates and Ezine

As an added bonus you will receive BG’s Updates and Ezine

All work listed on BonnieGortler.com is licensed under a Creative Commons Attribution - Noncommercial - No Derivative Works 3.0 Unported License.
