

Bonnie’s Market Update 3/28/25
03/30/2025
Markets can remain irrational longer than you can remain solvent. – John Maynard Keynes
The historical tendency for stocks to under perform from May-October period is not materializing. The stock market continues to act well, with the bulls in control. The S&P 500 (SPY) on light volume broke through resistance, achieving a new high on June 9, 2014 at 196.05. A short term pull back followed to 193.10. Aggressive sectors have come back to life. The Internet sector, emerging markets and the small caps have led the market higher The relative strength has shifted to the Small Caps (IWM) being stronger than the S&P 500 (SPY) which I had mentioned in the in the May 30th newsletter. The IWM peaked at its short term resistance, of 117.48, pulled back to 114.66 but once again the IWM is challenging short term resistance trading at 116.77 as of this writing.
The resilient advance continues to see money moving in and out of different sectors as the S&P remains a steady profitable area of investment. For the market to show signs of further advance I would like to see the small caps (IWM) continue to lead in relative strength over the S& P 500 and break through the short term resistance at 120.00,as well as the financial sector to catch fire and lead the market higher.
What are the charts saying now?–Small-cap iShares Russell 2000 Index ETF (IWM) Weekly
Small caps have been a weak area of the market this year, trading below the uptrend line from the lows of 2012. IWM fell 10.9% from its recent peak in March but has rebounded 9.3 % from its May 15 low. If the IWM could break above the downtrend line that is acting as resistance, a more meaningful rally could occur sooner rather than later.
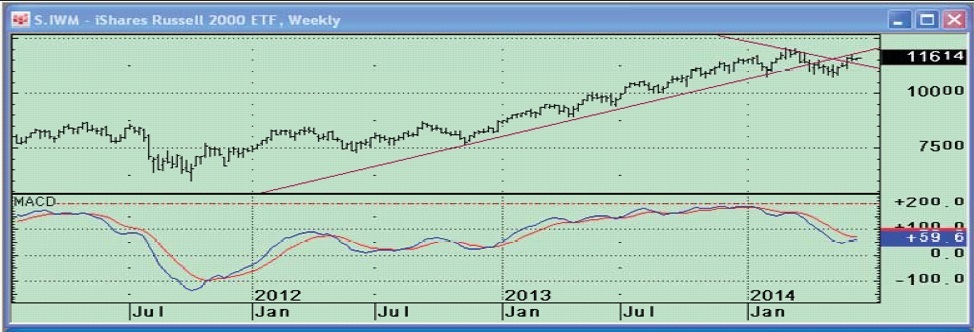
The momentum indicator MACD inthe bottom portion of the IWM chart has turned up, a good sign but still needs to be monitored closely to see the impulse of the next rally. Notice how MACD is now here near its peak, so a potential negative divergence could take place in the next few weeks if a new price high is made. The first upside objective is 120.00, followed by 125.00.
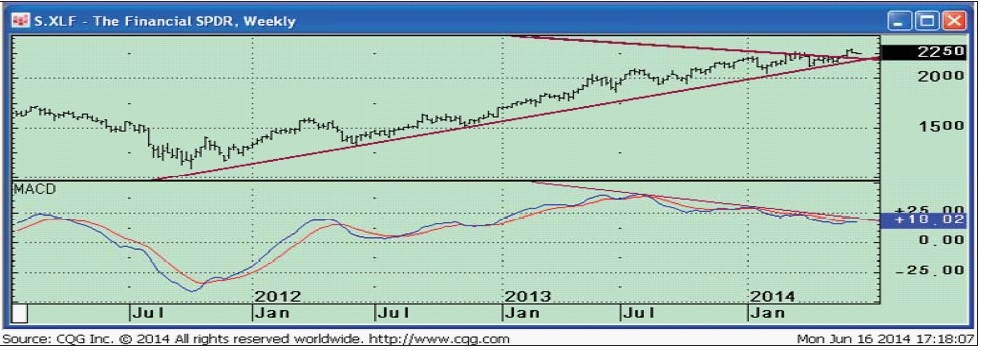
I believe the market needs a new catalyst for the advance to broaden. When Financials are leaders the market historically does well. The chart to the right is the weekly Financial Select Sector SPDR ETF XLF, an exchange traded fund that gives you a broad exposure to the U.S. financial-services sector. XLF is predominantly made up of diversified financial-services companies and commercial banks. The top five holdings as of 06/16/2014 are Wells Fargo & Co (WFC) 8.85%, Berkshire Hathaway B (BRK.b) 8.22%, JP Morgan Chase & Co (JPM) 7.79%, Bank of America Corp (BAC) 5.84%, and Citigroup (C) 5.23%, for a total of 35.93%. The XLF broke its weekly down trend on May 27th, and then retraced the break out. The first upside objective is 23.40, followed by 24.25. The lower portion of the chart is MACD illustrating as prices have moved higher, momentum gets weaker.
It would be bullish if the MACD could break the downtrend from July 2014 and confirm the price breakout.
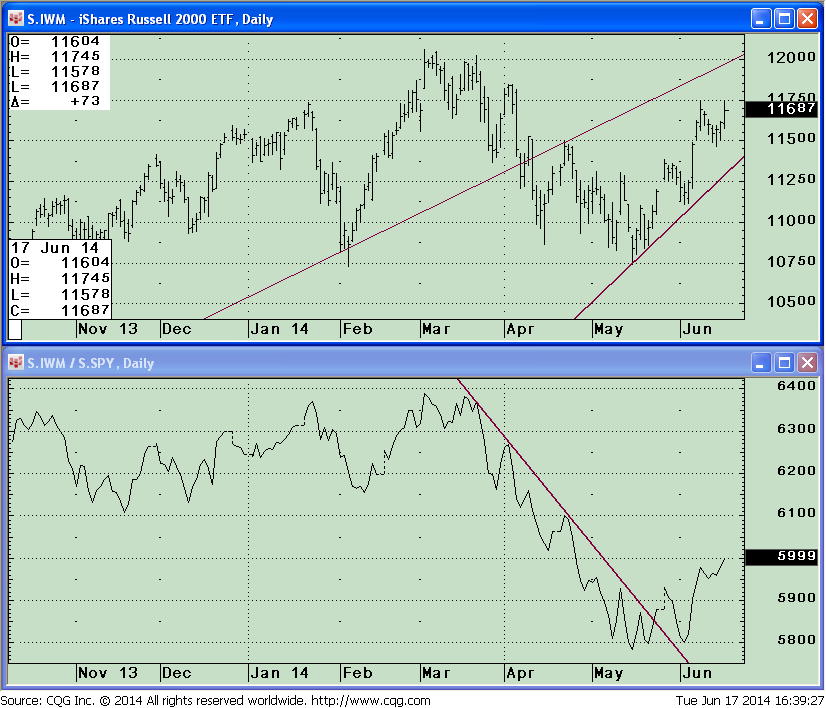
I am expecting the market to work its way higher. The top portion is the Russell 2000 small cap (IWM) daily chart (left) which clearly shows the 120 resistance zone near the old highs, with a key line of resistance also corresponding on the weekly chart. If penetrated this would be bullish and confirm my optimistic viewpoint. If once again the IWM stalls in this area and small caps start to lose strength then I would be incorrect and prices will retreat towards support at 112.50.
The second (lower) chart is the daily IWM/SPY relative strength ratio that is now rising and gaining strength. The IWM is stronger than the S&P 500 (SPY) and successfully tested the bullish breakout.
Just to Sum Up:
The old adage of “The trend is your friend” is what I recommend. Market volatility is low, the number of new lows are very small, aggressive sectors have stabilized which is favorable and suggest risk is contained for the time being. Small caps are now leaders and the financial sector is in position to be the next leader of the advance which could be the catalyst to fuel the market higher. I continue to give the market the benefit of the doubt.
Please share your stock market insights by calling me at 1-844-829-6229 or Email me at bgortler@signalert.com with your comments.


Create more wealth in your life
with these simple strategies.
As an added bonus you will also
receive BG’s Updates and Ezine

Discover how to quickly create more well-being in your life with these simple strategies.
As an added bonus you will also
receive BG’s Updates and Ezine

As an added bonus you will receive BG’s Updates and Ezine

All work listed on BonnieGortler.com is licensed under a Creative Commons Attribution - Noncommercial - No Derivative Works 3.0 Unported License.
