

Bonnie’s Market Update 4/11/25
04/13/2025
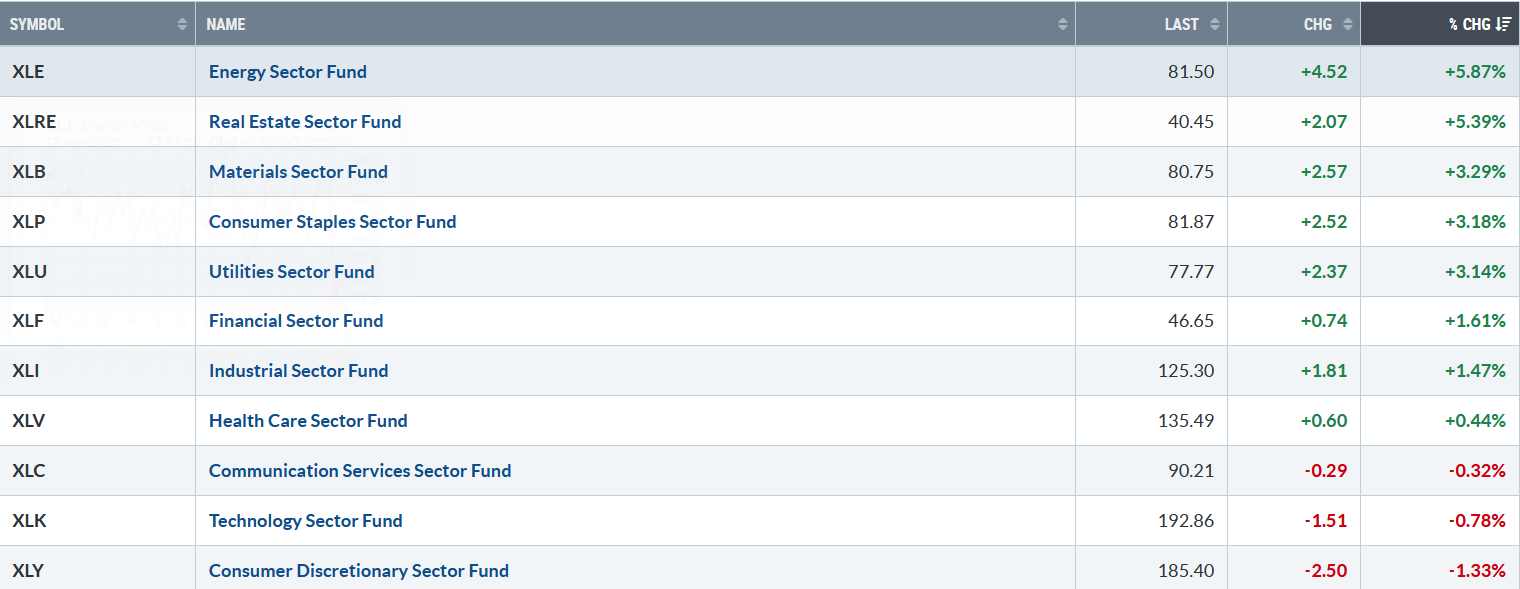
Volatility quiets. Eight of eleven S&P SPDR sectors were higher. Energy (XLE) and Real Estate (XLRE) were the strongest sectors, while Technology (XLK) and Consumer Discretionary (XLY) were the weakest sectors. The SPDR S&P 500 ETF Trust (SPY) fell -1.41% in a shortened trading week.
S&P SPDR Sector ETFs Performance Summary 4/10/25 – 4/17/25
041725 weekly SPDR Sectors
Source: Stockcharts.com *** Note performance is Thursday 4/10-Thursday 4/17
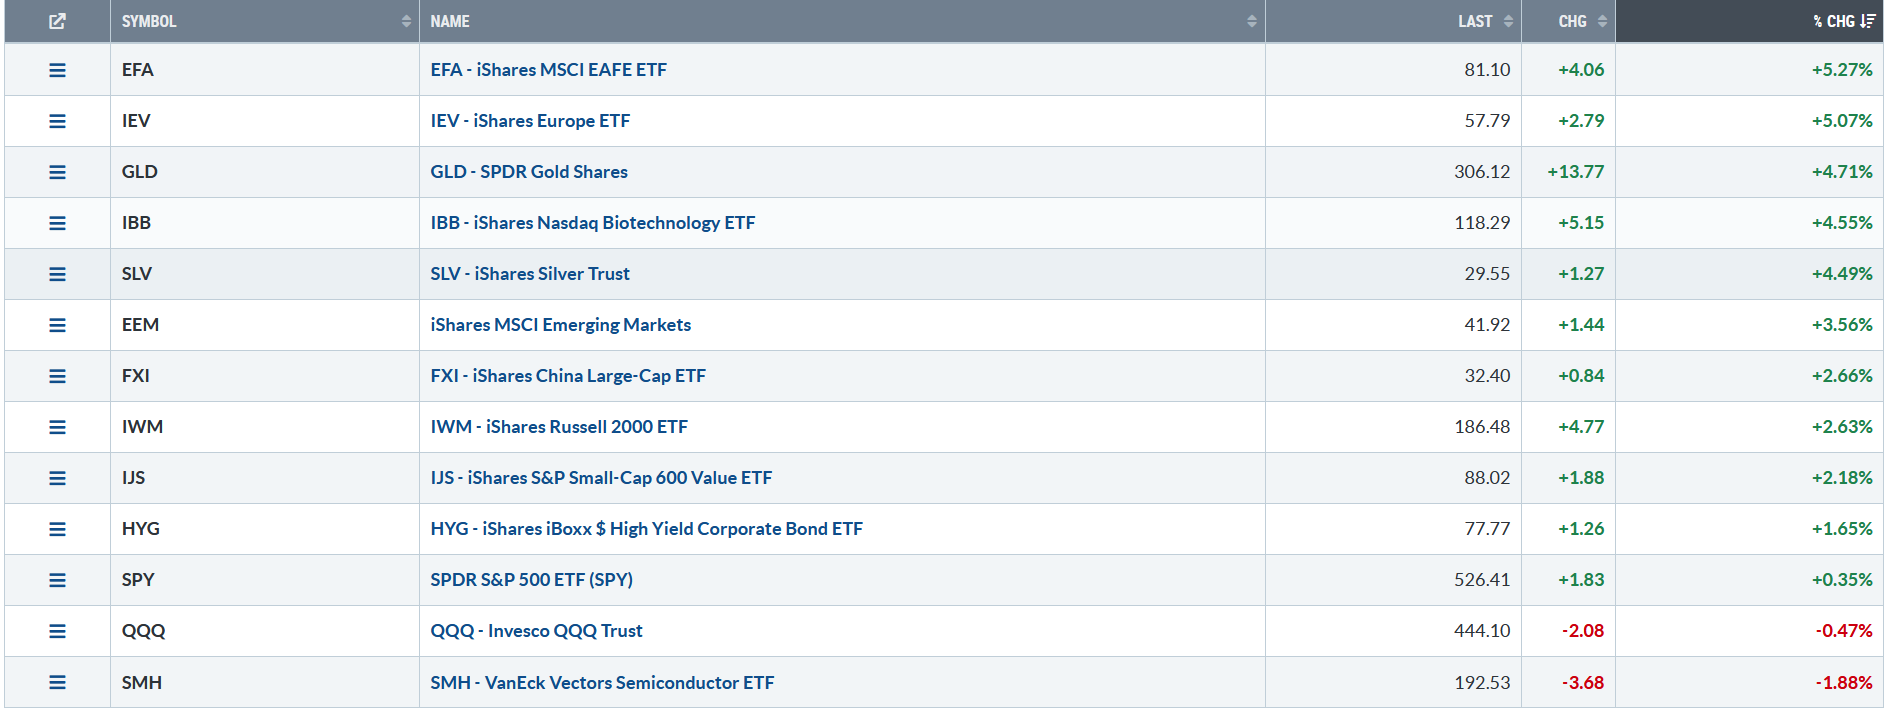
Figure 2: Bonnie’s ETFs Watch List Performance Summary 4/10/25 – 4/17/25
041725 Bonnie’s ETF Watch List
Source: Stockcharts.com ***Note performance is Thursday 4/10-Thursday 4/17
International, Gold, Silver, and Biotechnology were leaders last week. Small Cap Value and Growth stopped declining and outperformed the S&P 500. Semiconductor and Technology lag.
Figure 3: Fear & Greed Index

041725 CNN Fear and Greed Index
Source. CNN.com
Investor sentiment, measured by the Fear and Greed Index (a contrarian index), upticked to 21, remaining in the extreme fear zone, where good buying opportunities arise.
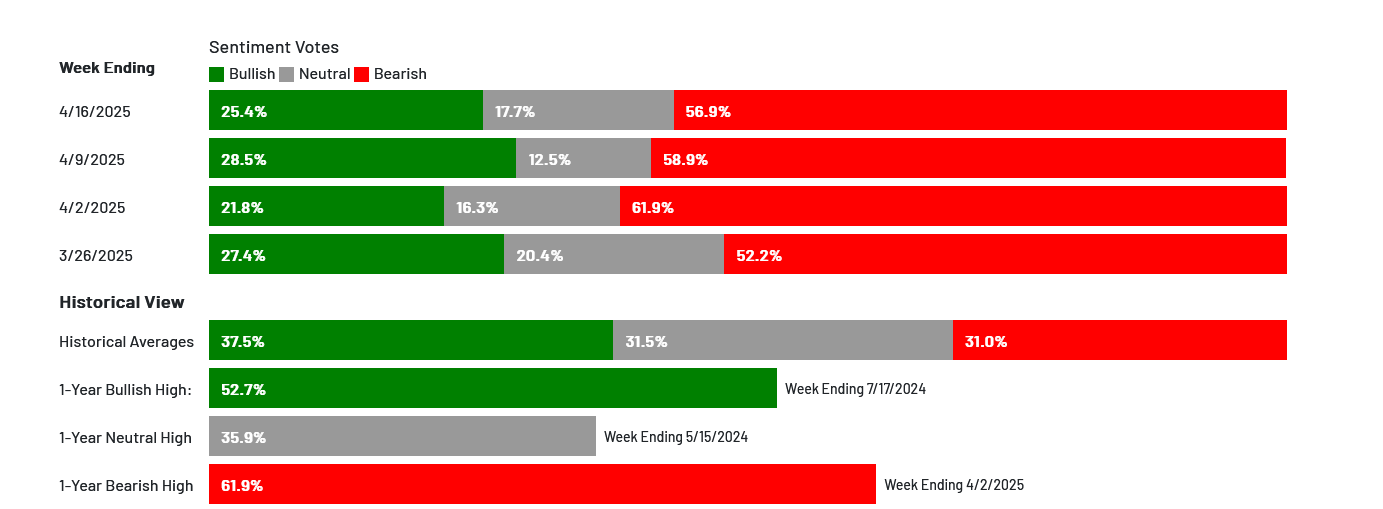
Figure 4: The AAII Sentiment Survey, week ending 4/16/25
041625 AAII Sentiment
Source https://www.aaii.com
Bullish sentiment, expectations that stock prices will rise over the next six months, decreased 3.1 percentage points to 25.4%. Bullish sentiment is unusually low and is below its historical average of 37.5% for the 14th time in 16 weeks.
I invite you to join my Facebook Group. Learn more about it here: Wealth Through Market Charts.
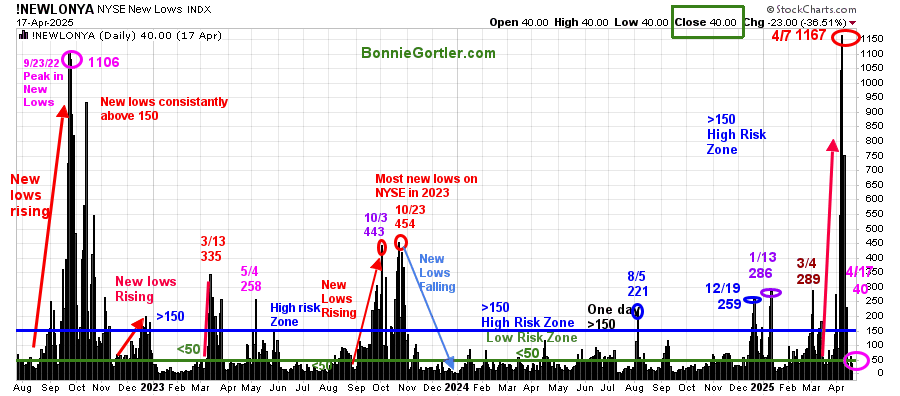
Figure 5: NYSE New Lows
041725 NYSE New Lows
Source: Stockcharts.com
New Lows on the NYSE rose in December 2024, with a high of 259. They briefly contracted before peaking at 286 (purple circle) on 1/13/25. New lows in early 2025 hit high risk a few times, contracted, and then increased. New Lows peaked at 1167 on 4/7 and then contracted.
Last week, New Lows closed at 40, falling to a low-risk zone below 50. It would be positive in the short term if New Lows stay below 50, falling under 25. However, New Lows rising to above 150 would imply a higher risk of a decline in the near term. Learn more about the significance of New Lows in my book, Journey to Wealth, published on Amazon. If you would like a preview, get a free chapter here.
Figure 6: CBOE Volatility Index (VIX)
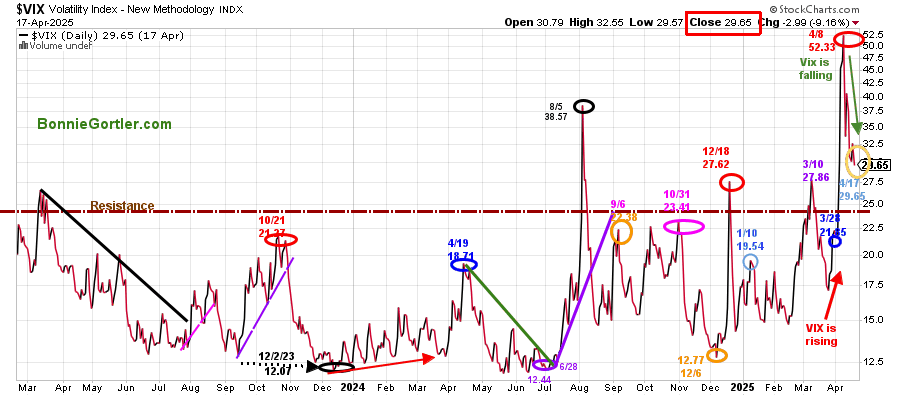
041725 VIX Daily
Source: Stockcharts.com
The CBOE Volatility Index (VIX), a measure of fear, continued falling last week to 29.65 (orange circle). Intraday volatility will likely be less than the first two weeks in April. However, VIX remains at a high reading historically.
Figure 7: S&P 500 Weekly (SPY)
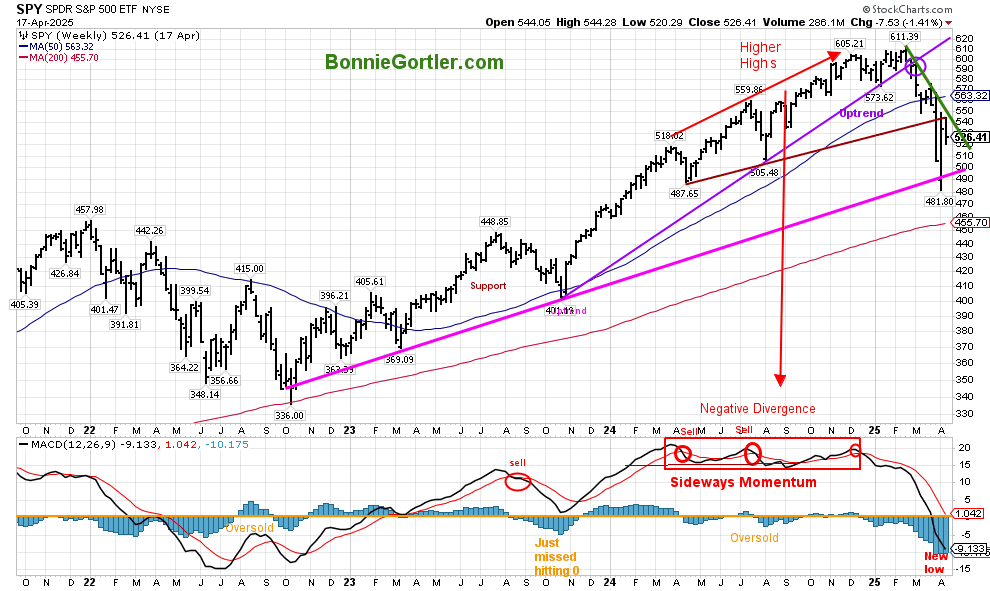
041725 Weekly SPY
Source: Stockcharts.com
The S&P 500 (SPY) top chart remains in an intermediate downtrend. It’s encouraging that SPY did not make a new low and closed the week above the 2022 uptrend line (pink line, top chart). The SPY is not out of the woods yet, as there was insufficient strength to break the 2025 downtrend (green line, top chart) and shift the intermediate trend to positive.
MACD (bottom chart) continues to fall, making a new intermediate momentum low for the year and the lowest since 2022. Currently, no low-risk buying pattern has developed for the intermediate term. You want to see a slowing in downside momentum, a turn-up, and MACD get above 0 for an intermediate-term sustainable rally.
If the SPY closes above 545.00, it would be positive. On the other hand, if the SPY closes below 481.80, it would likely trip the sell stops and imply further downside toward 455.00.
Learn how to implement a powerful wealth-building mindset and charting strategies to help you grow your wealth in the comfort of your home in my eCourse, Wealth Through Investing Made Simple. Learn more here.
Figure 8: S&P 500 Daily (SPY)
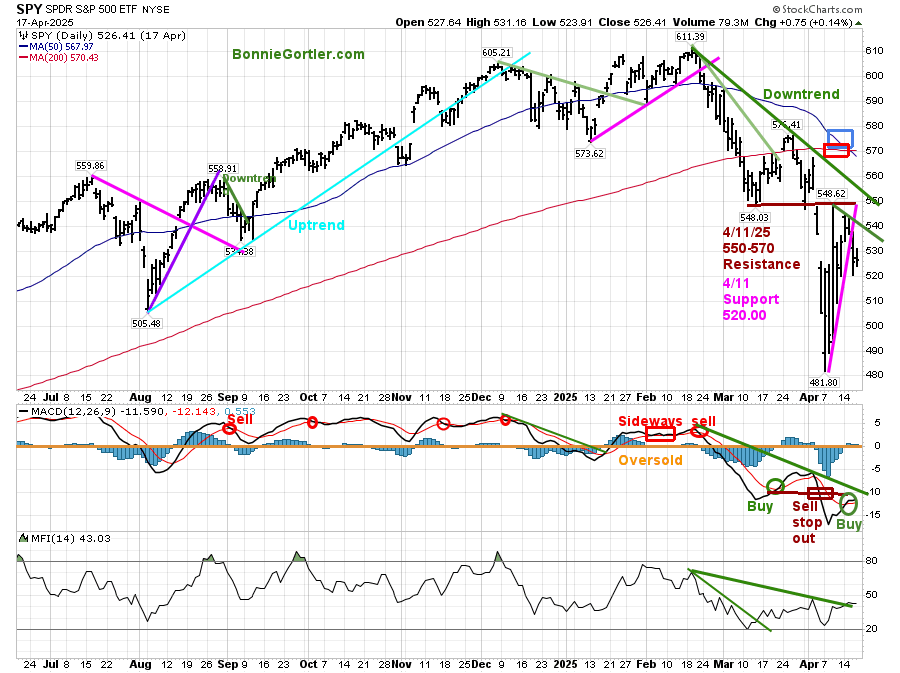
041725 SPY Daily
Source: Stockcharts.com
The short-term remains down (green lines), with the S&P 500 (SPY) falling -1.47% last week, breaking the April uptrend (pink line).
Resistance is between 540.00, 550.00, and 570.00. Support is at 520.00, 510.00, and 500.00.
MACD gave a fresh buy last week. However, it would be more convincing and a confirmation given if MACD breaks the February downtrend in momentum.
Figure 9: Daily iShares Russell 2000 (IWM) Price (Top) and 12-26-9 MACD (Bottom)
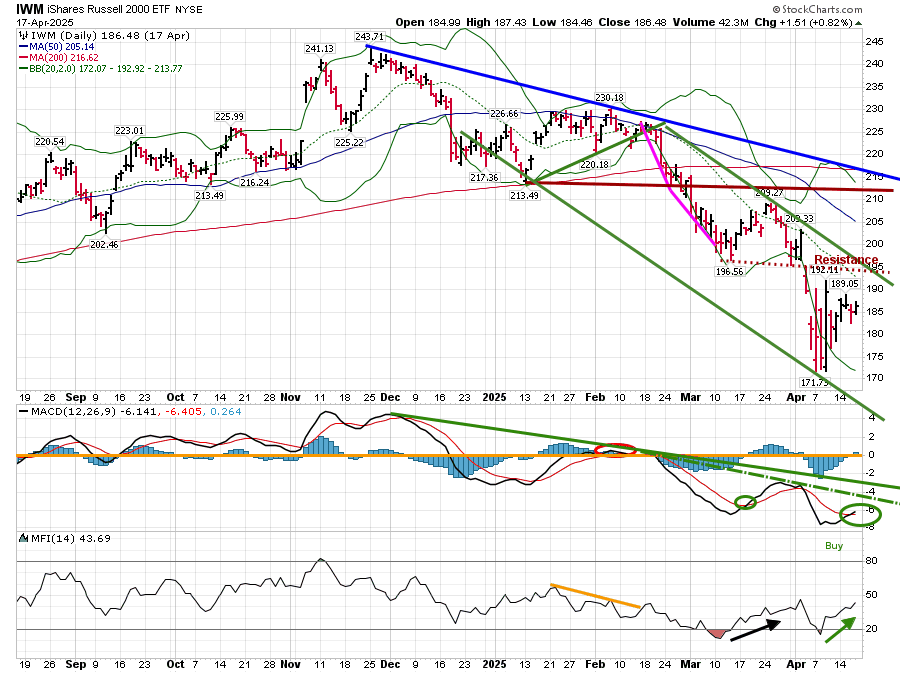
041725 IWM Daily
Source: Stockcharts.com
The iShares Russell 2000 Index ETF (IWM) downtrend since November 2024 (blue line) is still in effect, and it closed below the 50-day (blue rectangle) and 200-day MA (red rectangle).
IWM bucked the trend and rose +1.15% last week, outperforming the S&P 500, a positive sign. Resistance is 192.00, 197.00, 205.00, and 212.00. Support is 178.00, 173.00, and 170.00.
MACD (lower chart) generated a buy last week, rising and below 0. Breaking the downtrends in momentum would be favorable.
Money Flow (lower chart) is rising. A further rise in Money Flow would be positive.
Two closes above 192.00, and the MACD downtrend broken, would likely attract new buying in small caps.
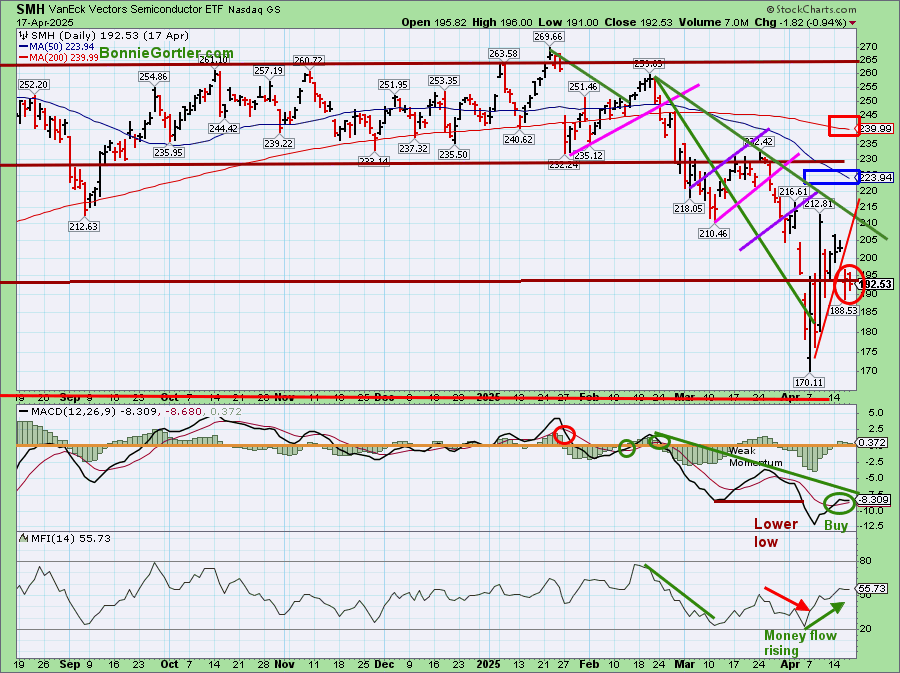
Figure 10: Daily Semiconductors (SMH) (Top) and 12-26-9 MACD (Middle) and Money Flow (Bottom)
041725 SMH Daily
Source: Stockcharts.com
The top chart shows the Daily Semiconductors (SMH) ETF, concentrated mainly in US-based Mega-Cap Semiconductor companies. SMH tends to be a leading indicator for the market when investors are willing to take on increased risk, and the opposite is true when the market is falling.
SMH remains below the 50 (blue rectangle) and 200-day MA (red rectangle).
SMH lagged last week, lacking strength and breaking the April uptrend (redline).
Support is 191.00, 180.00, and 170.00. Resistance is at 196.00, 205.00, 210.00, and 220.00.
MACD, a measure of momentum (middle chart), generated a buy after making a low in momentum the previous week.
Money flow (lower chart) is rising despite the weakness, which is positive in the short term.
Sum Up:
In a shortened holiday week, the major averages fell, remaining below key moving averages. Daily momentum patterns and market breadth have improved, implying the worst is likely over. As the bottoming process continues, more time is needed to get through overhead resistance. Look for small-cap and technology stocks to give a clue to direction as the earnings season continues and uncertainty remains. Manage your risk, and your wealth will grow.
If you want to explore the charts further and get to know each other better, email me at Bonnie@BonnieGortler.com, or you can go directly to my calendar to schedule a time Here.
If you like this market update, you will love my free Charting Master Class. Learn more HERE.


Create more wealth in your life
with these simple strategies.
As an added bonus you will also
receive BG’s Updates and Ezine

Discover how to quickly create more well-being in your life with these simple strategies.
As an added bonus you will also
receive BG’s Updates and Ezine

As an added bonus you will receive BG’s Updates and Ezine

All work listed on BonnieGortler.com is licensed under a Creative Commons Attribution - Noncommercial - No Derivative Works 3.0 Unported License.
