

Bonnie’s Market Update 3/14/25
03/15/2025
Volatility continued. Selling pressure continued last week until Friday’s upside reversal. Two of the eleven S&P SPDR sectors were higher, Energy (XLE) and Utilities (XLU), while Consumer Staples (XLP) and Consumer Discretionary (XLY) were the weakest sectors. The SPDR S&P 500 ETF Trust (SPY) fell -2.28%.
S&P SPDR Sector ETFs Performance Summary 3/7/25 – 3/14/25
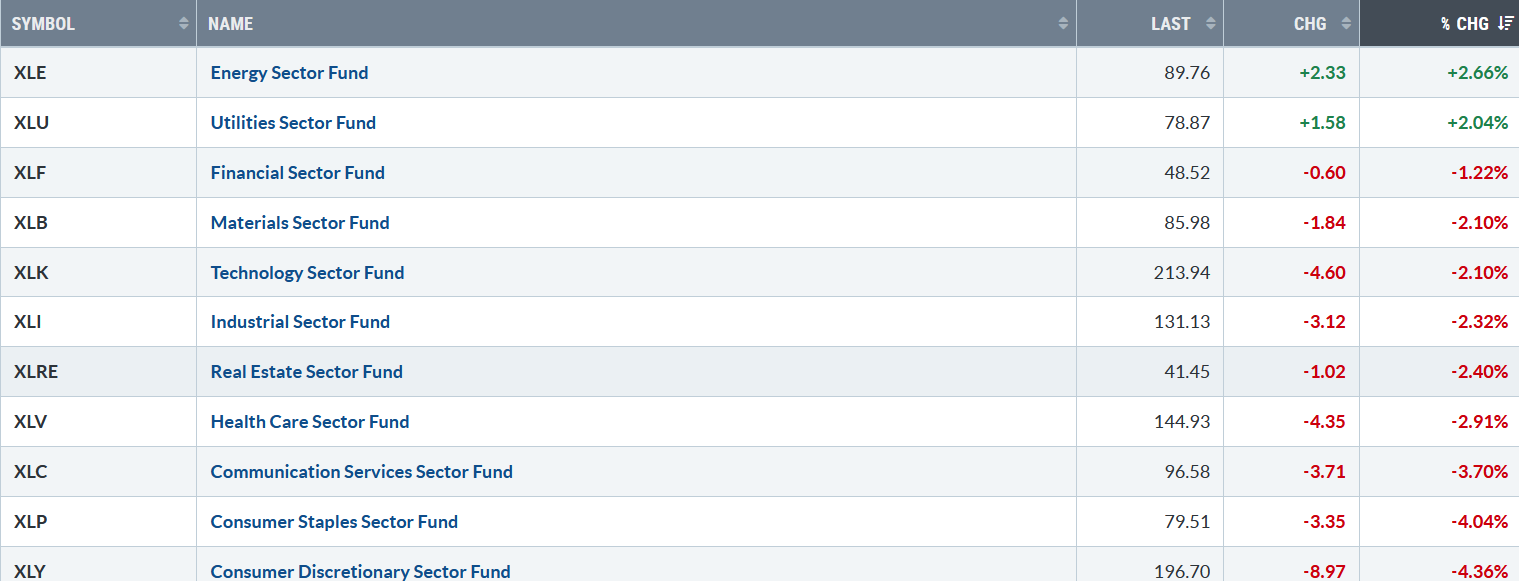
031425 weekly SPDR Sector
Source: Stockcharts.com
Figure 2: Bonnie’s ETFs Watch List Performance Summary 3/7/25 – 3/14/25
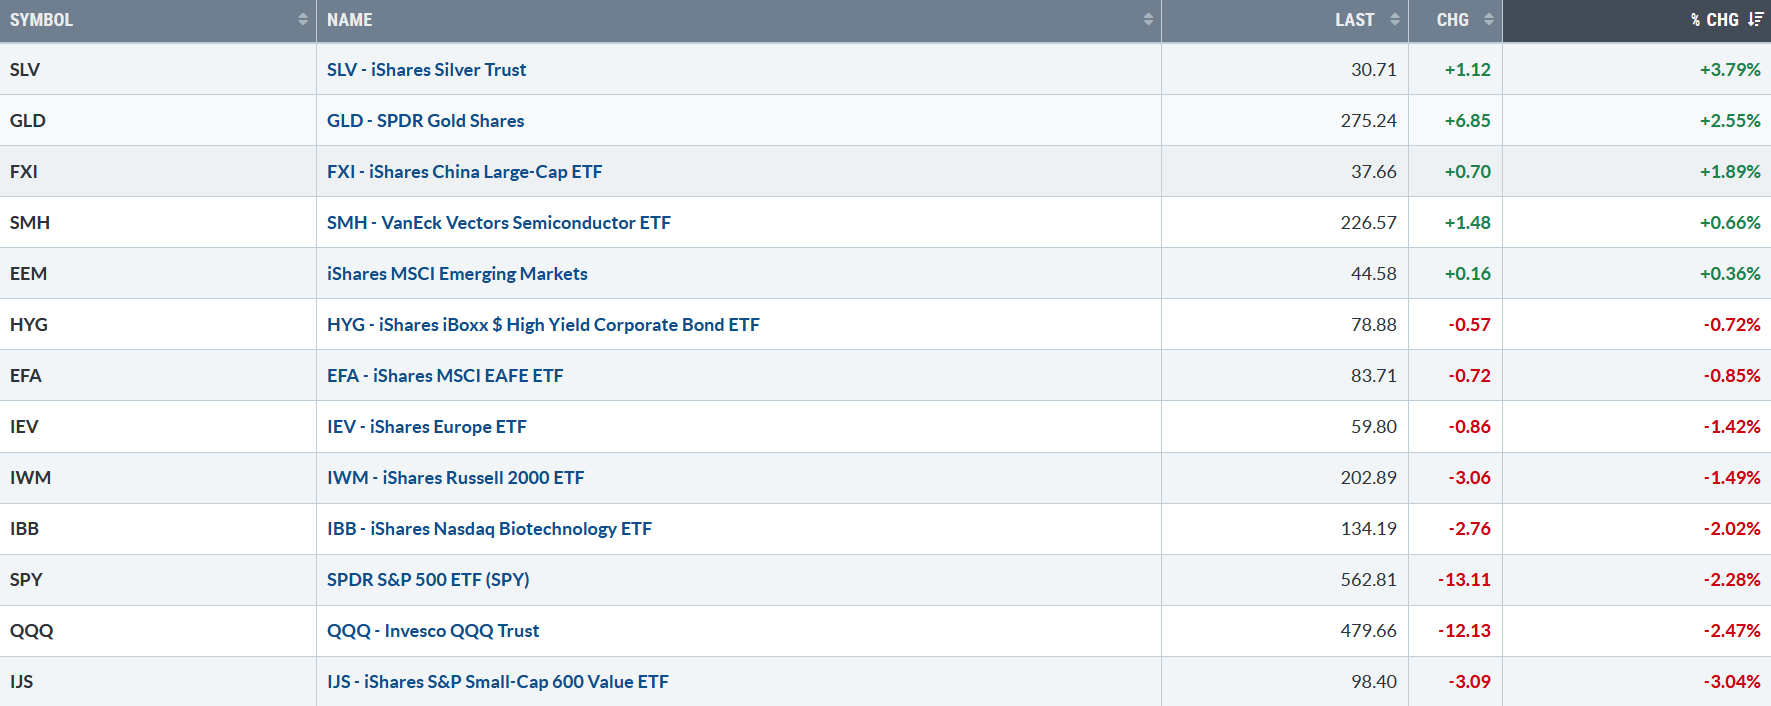
031425 Bonnie’s ETF Watch List
Source: Stockcharts.com
Silver and Gold showed good gains. Semiconductors were down all week, finished higher, and led the Friday advance. S&P 500, Nasdaq 100 Small Cap Growth and Value were lower.
CHARTS CHARTS AND MORE CHARTS FOR YOU TO REVIEW. GO HERE.
Figure 3: Fear & Greed Index
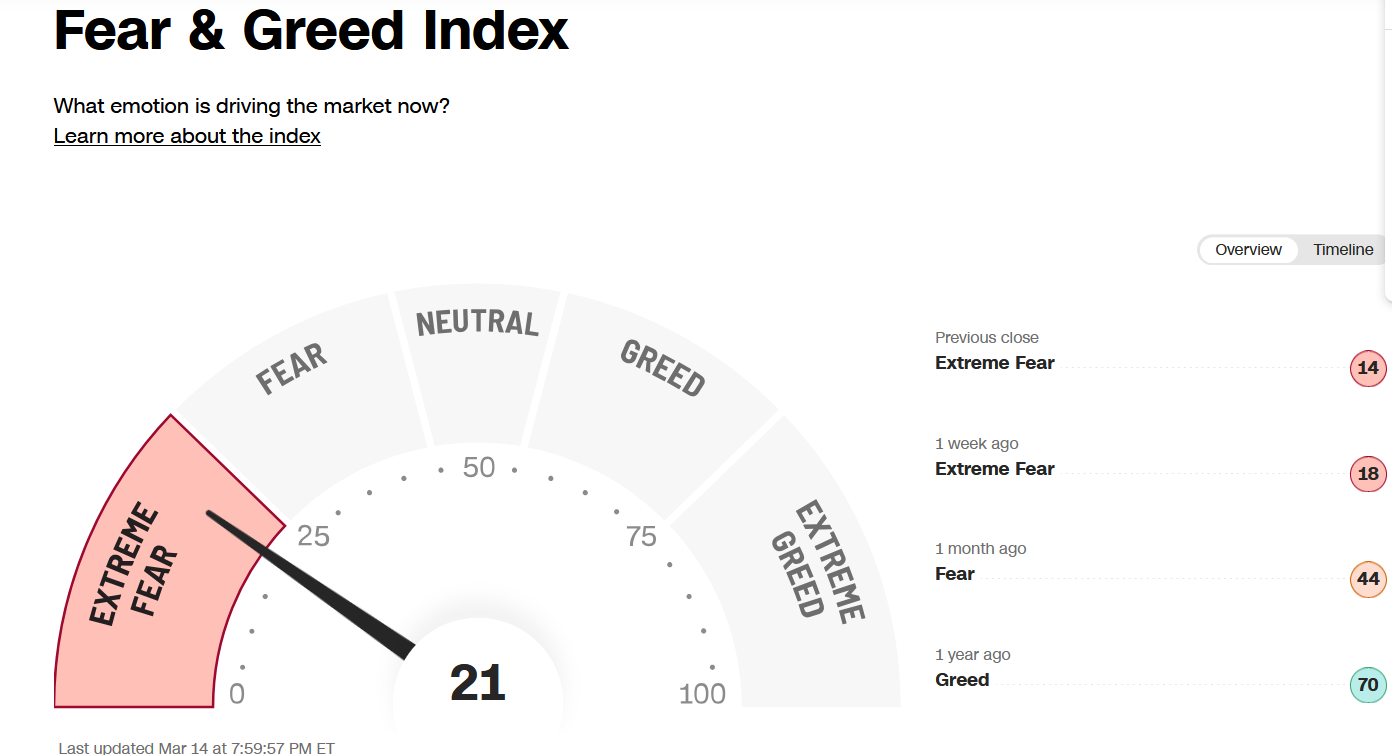
031425 CNN Fear and Greed Index
Source: CNN.com
Investor sentiment, measured by the Fear and Greed Index (a contrarian index), closed at 21, remaining in the extreme fear zone, often where good buying opportunities arise.
Figure 4: NYSE New Lows
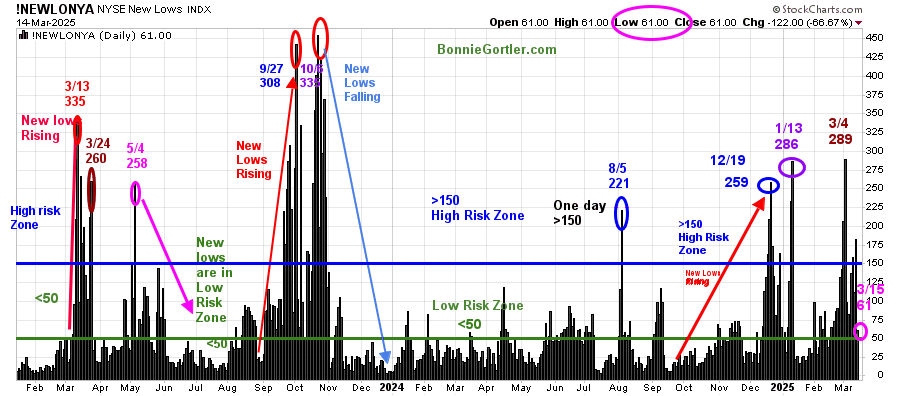
031425 NYSE New Lows
Source: Stockcharts.com
New Lows on the NYSE rose in December 2024, with a high of 259. They briefly contracted before peaking at 286 (purple circle) on 1/13/25 and then contracted.
New lows in 2025 have hit high risk a few times this year, and then contracted. Last week, they were above 150 but quickly contracted and closed Friday, 3/14, at 61 (pink circle), no longer in the high-risk zone. Watch New Lows to see if New Lows expand above 150, implying an increased risk of the downtrend continuing or remaining below 100 and contracting between 25 and 50, which would be positive for the short term.
Learn more about the significance of New Lows in my book, Journey to Wealth, published on Amazon. If you would like a preview, get a free chapter here.
Figure 5: Daily iShares Russell 2000 (IWM) Price (Top) and 12-26-9 MACD (Bottom)
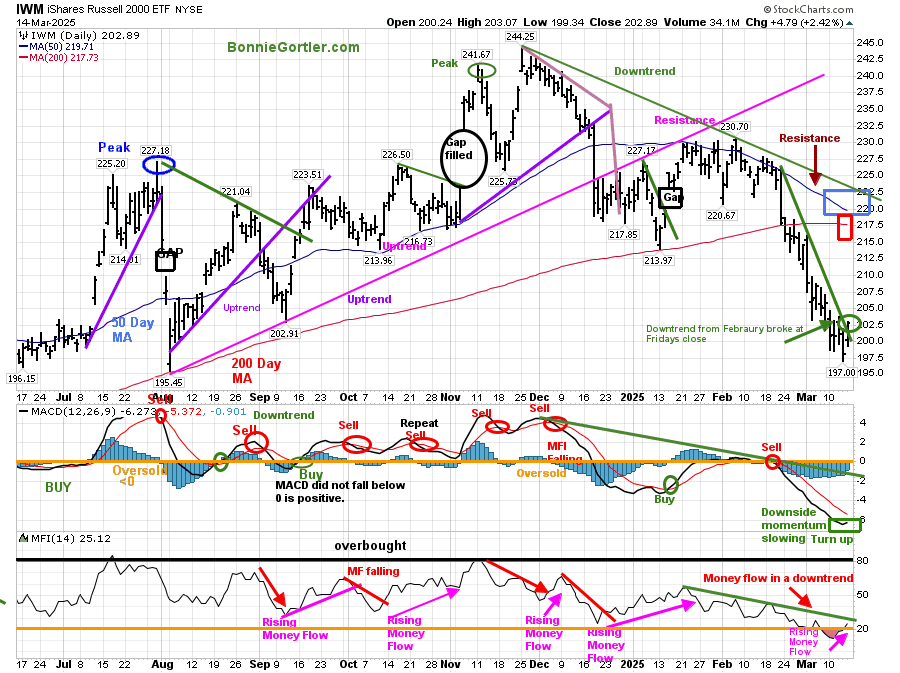
031425 IWM Daily
Source: Stockcharts.com
The iShares Russell 2000 Index ETF (IWM) fell -1.49% last week, continuing to be weaker than the S&P 500. However, Friday’s reversal and outperformance of the S&P 500 was encouraging.
IWM has maintained a downtrend since December 2024 (green line). IWM continues to close below the 50-day (blue rectangle) and 200-day MA (red rectangle) out of favor of investors.
MACD (lower chart) remains on a sell, below 0, but encouraging MACD turned up with less downside momentum, and Money Flow (lower chart) continues to rise and breaks the downtrend (green line).
It’s too early to declare a bottom with IWM price below the 50 and 200-day MA. A more sustainable rally could occur if MACD generates a buy and breaks the momentum downtrend (green line) from December 2024 and IWM closes above 220.00.
Figure 6: Daily Semiconductors (SMH) (Top) and 12-26-9 MACD (Middle) and Money Flow (Bottom)
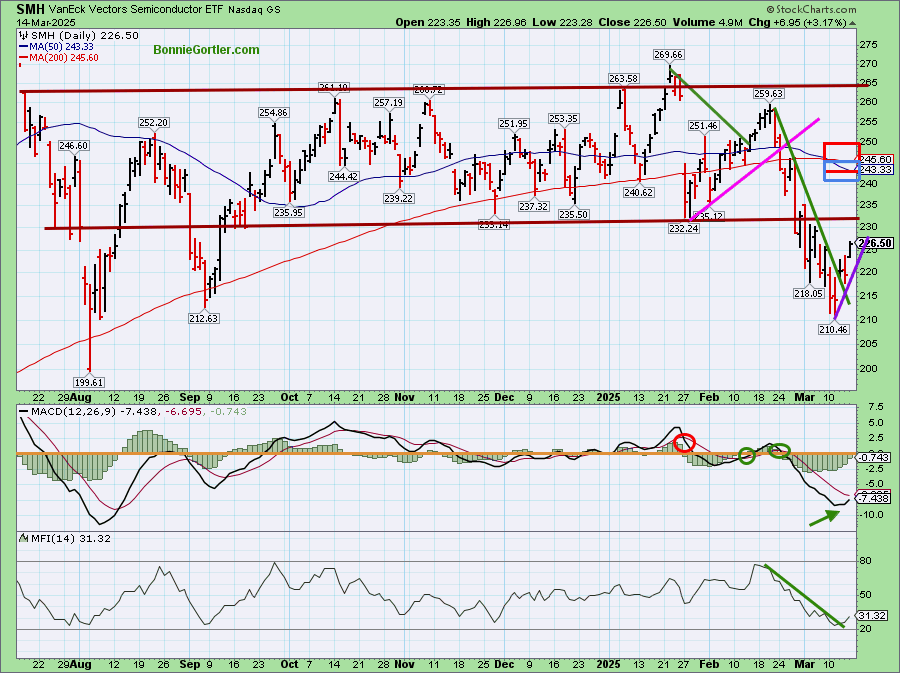
031425 SMH Daily
The top chart shows the Daily Semiconductors (SMH) ETF, concentrated mainly in US-based Mega-Cap Semiconductor companies. SMH tends to be a leading indicator for the market when investors are willing to take on increased risk, and the opposite is true when the market is falling.
The tape action for the Semiconductor ETF (SMH) was positive on Friday 3/14, closing at 226.50, up +3.17%, to finish the week with a gain of +0.66%. However, like IWM and other major averages, price remains below the 50 (blue rectangle) and 200-day MA (red rectangle), a sign of underlying weakness.
Support at 223.00 and 220.00. Resistance at 233.00, 240.00, and 246.00.
Continued leadership in SMH would be positive for the broad market.
Sum Up:
A volatile week where selling pressure in technology and semiconductor stocks subsided Friday, fueling a strong broad relief rally on significant upside to downside volume and positive market breadth. The major averages and many stocks remain in a downtrend after a sharp correction. Option expiration this week and quarterly window dressing will add to volatility and possibly a reversal of the selling pressure that we have had in the last few weeks. The bottoming process continues as short-term momentum oscillators are oversold and in a position where rallies occur. Its positive downside momentum is slowing, implying that the worst of the decline is likely over. Watch for follow-through to Friday’s rally-breaking price downtrends, penetrating resistance, and strong market breadth for the New York Stock Exchange Index and Nasdaq. Manage your risk, and your wealth will grow.
If you want to go deeper into the charts and get to know each other better, email me at Bonie@BonnieGortler.com, or if you prefer, you can go directly to my calendar to schedule a time Here.
If you like this market update, you will love my free Charting Master Class. Learn more HERE.


Create more wealth in your life
with these simple strategies.
As an added bonus you will also
receive BG’s Updates and Ezine

Discover how to quickly create more well-being in your life with these simple strategies.
As an added bonus you will also
receive BG’s Updates and Ezine

As an added bonus you will receive BG’s Updates and Ezine

All work listed on BonnieGortler.com is licensed under a Creative Commons Attribution - Noncommercial - No Derivative Works 3.0 Unported License.
