

Bonnie’s Market Update 4/11/25
04/13/2025
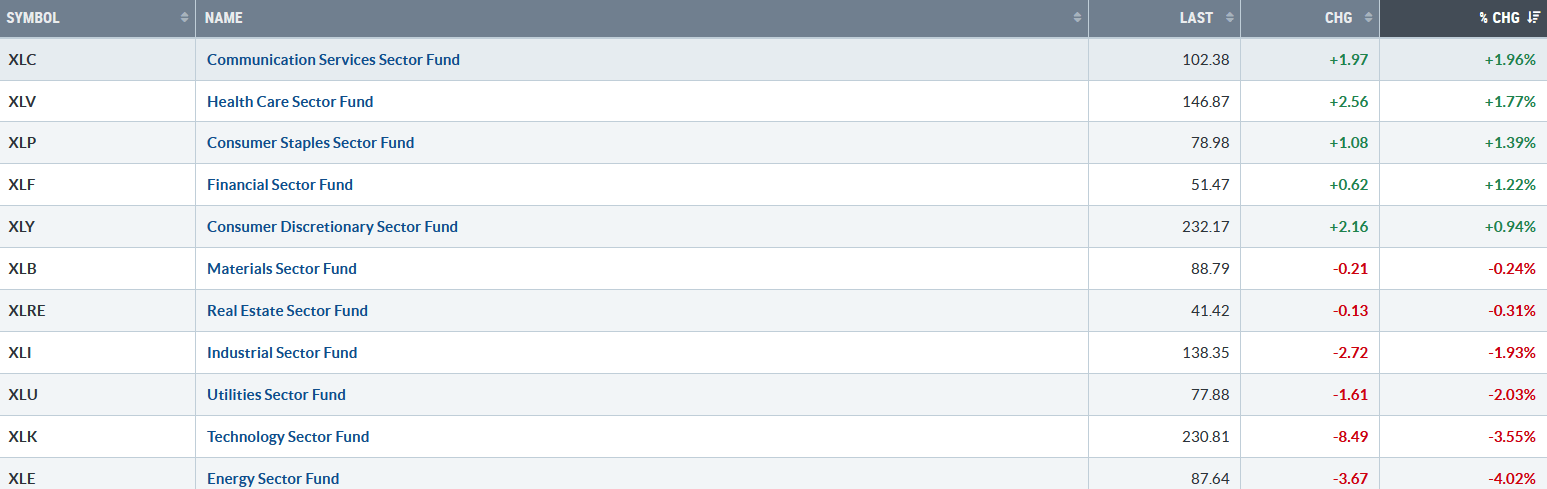
It was a volatile week. Only five of eleven S&P SPDR sectors finished higher. Communication Services (XLC) and Healthcare (XLV) were the leading sectors for the second week in a row, while Technology (XLK) and Energy (XLE) were the weakest sectors. The SPDR S&P 500 ETF Trust (SPY) fell -1.01%.
S&P SPDR Sector ETFs Performance Summary 1/24/25 – 1/31/25
013125 SPDR Sectors
Source: Stockcharts.com
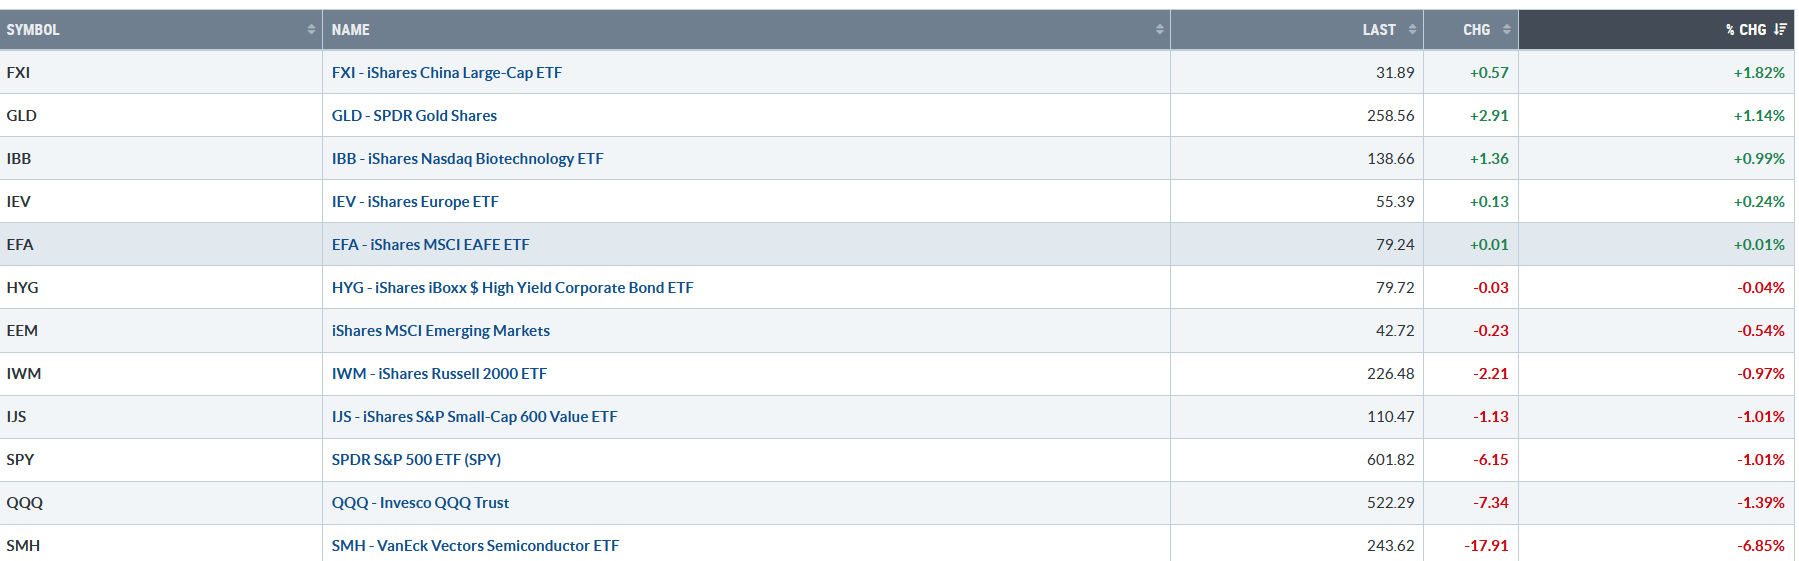
Figure 2: Bonnie’s ETFs Watch List Performance Summary 1/24/25 – 1/31/25
013125 Bonnie’s ETF Watch List
Source: Stockcharts.com
China and Gold led, while Semiconductors and Technology were weak.
If you like charts, I invite you to join my Facebook Group. Learn more about it here: Wealth Through Market Charts.
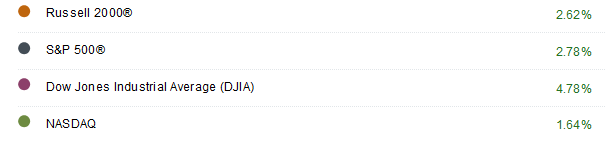
Figure 3: January: Performance Summary Market Indices
Jan 2025 Performance Market Indices
Source: Schwab
Historically, the major averages rising in January bodes well for 2025.
Figure 4: UST 10YR Bond Yields Daily

013125 UST 10 Yr Bond Yield
Source: Stockcharts.com
The 10-year U.S. Treasury fell last week, closing at 4.569, remaining below the 2024 high. Falling yields would support upside in U.S. equities, while rising yields are likely to put pressure on U.S. Equities.
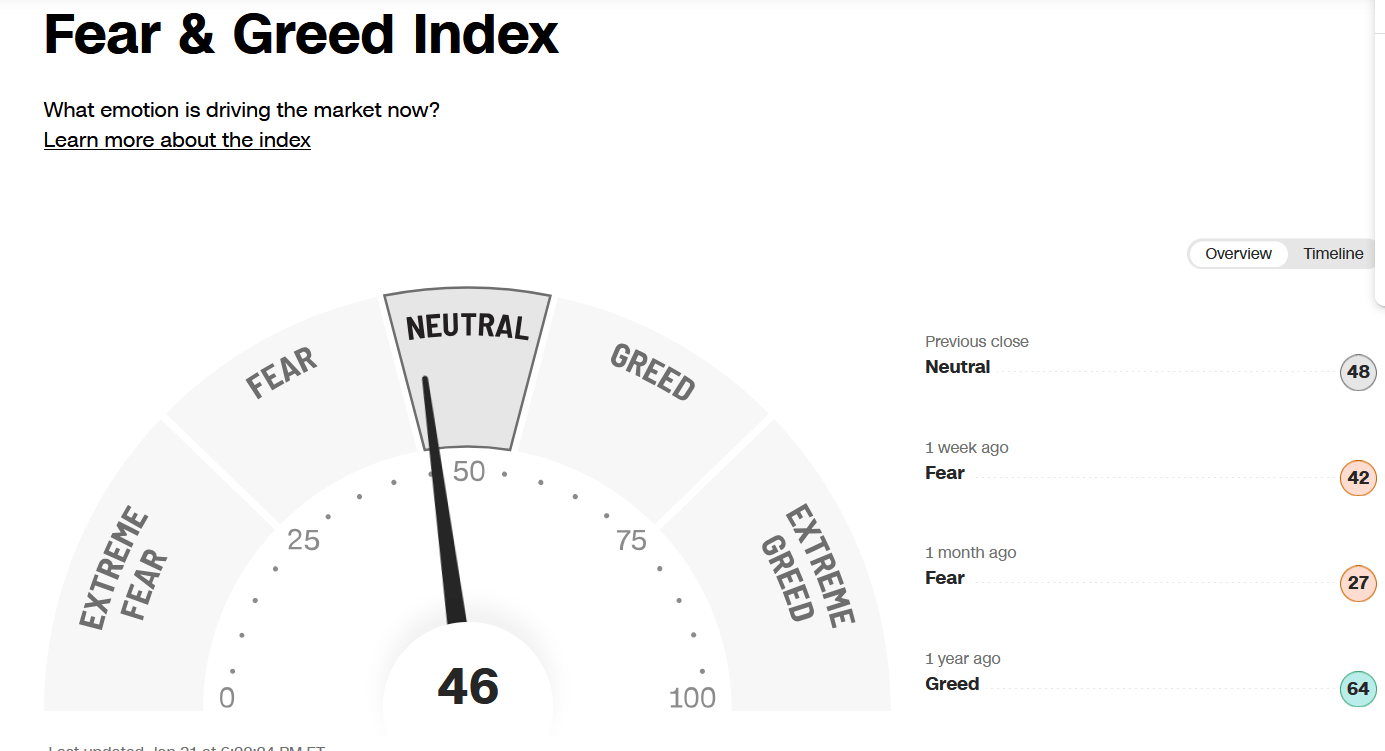
Figure 5: Fear & Greed Index
013125 CNN Fear and Greed Index
Source. CNN.com
Investor sentiment based on the Fear and Greed Index (a contrarian index) measures the market’s mood. The Fear and Greed Index dropped from 49 to 46, a neutral reading.
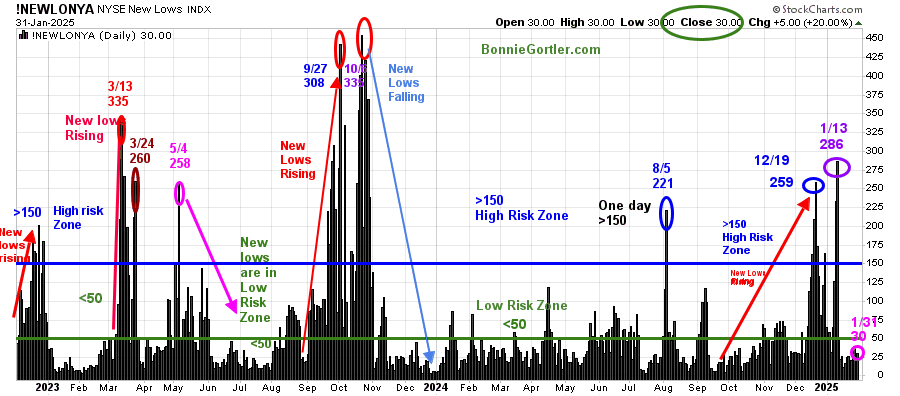
Figure 6: NYSE New Lows
013125 NYSE New Lows
Source: Stockcharts.com
New Lows on the NYSE rose in December 2024, with a high of 259, then briefly contracted before peaking at 286 (purple circle) on 1/13/25. Since then, New Lows have fallen into a low-risk zone, closing at 30 (pink circle).
Continue to watch New Lows to see if New Lows begin to expand for a potential shift to a sign of increased risk.
It is positive in the short term if new lows stay below 50 and less than 150. On the other hand, New Lows above 150 and continuing to rise would be a warning sign of weakness ahead.
Learn more about the significance of New Lows in my book, Journey to Wealth, published on Amazon. If you would like a preview, get a free chapter here.
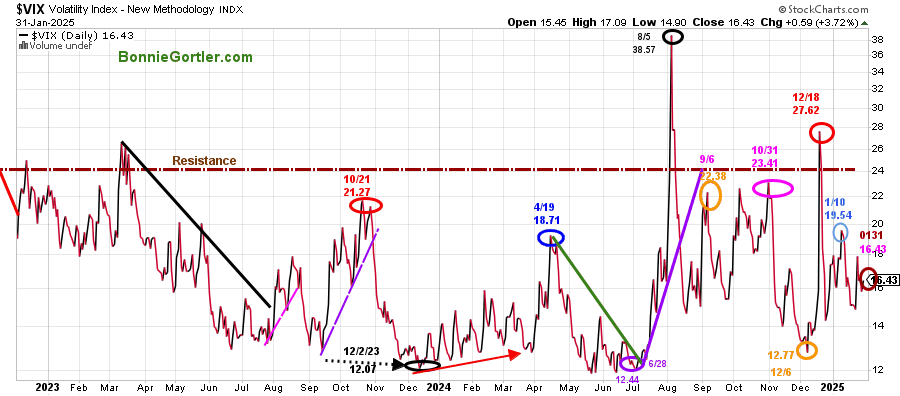
Figure 7: CBOE Volatility Index (VIX)
013125 VIX Daily
Source: Stockcharts.com
The CBOE Volatility Index (VIX), a measure of fear, rose last week, closing at 16.43 (brown circle), a relatively low reading, which is positive.
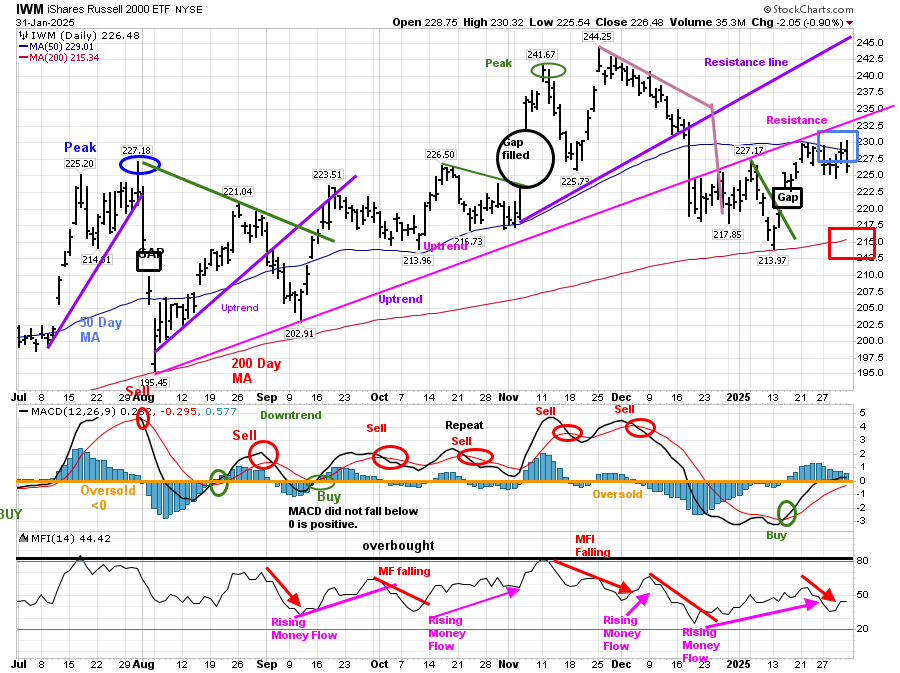
Figure 8: Daily iShares Russell 2000 (IWM) Price (Top) and 12-26-9 MACD (Middle) and Money Flow (Bottom)
013125 IWM Daily
Source: Stockcharts.com
The top chart is the daily iShares Russell 2000 Index ETF (IWM), the benchmark for small-cap stocks. It shows a 50-Day Moving Average (MA) (blue rectangle) and 200-Day Moving Average (MA) (red rectangle) that traders watch and use to define trends.
IWM fell -0.97% for the week, failing to penetrate resistance (pink line) and closed below the 50-day MA (blue rectangle) but remained above the 200-day MA (red rectangle).
Resistance remains between 230.00 and 235.00, followed by 245.50. Support is between 225.00, 219.00 and 213.00.
MACD remains on a buy (green circle) but is not showing any real strength, which is worrisome.
Money Flow is moving sideways. There is not much interest in small caps at this time.
Two closes below 213.00 would be negative. On the other hand, two closes above 230.32 would be positive and imply a test of the November high at 244.25.
You can explore Bonnie’s market charts from last week and more HERE.
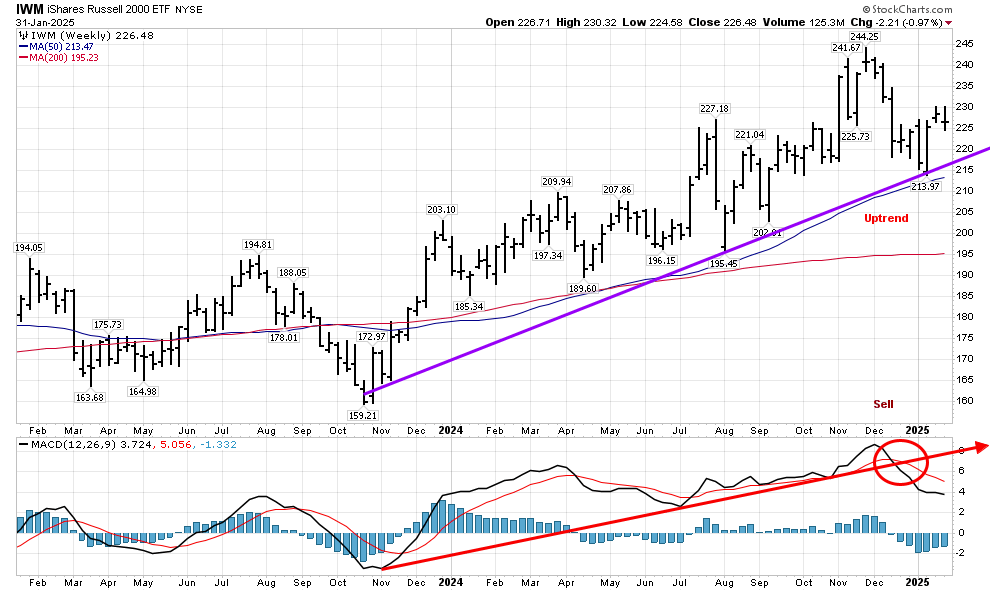
Figure 9: Weekly iShares Russell 2000 (IWM) Price (Top) and 12-26-9 MACD (Bottom)
013125 Weekly IWM
Source: Stockcharts.com
The Weekly iShares Russell 2000 Index ETF (IWM) intermediate trend remains intact from November 2023 (purple line). However, it is worrisome that the momentum uptrend from November 2023 (red line) broke, and MACD remains on a sell.
Learn how to implement a powerful wealth-building mindset and charting strategies to help you grow your wealth in the comfort of your home in my eCourse Wealth Through Investing Made Simple. Learn more here.
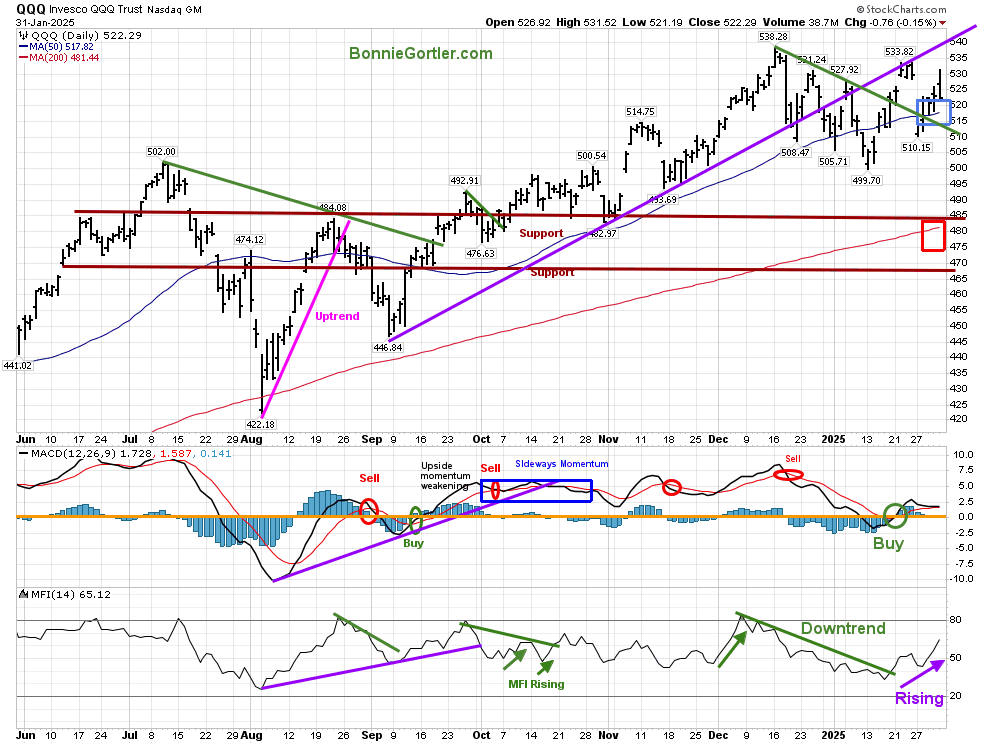
Figure 10: QQQ Daily Invesco QQQ Trust (QQQ) Price (Top) and 12-26-9 MACD (Middle) and Money Flow (Bottom)
 Source: Stockcharts.com
The Chart shows the daily Invesco QQQ, an exchange-traded fund based on the Nasdaq 100 Index.
QQQ fell by -1.39% for the week, remaining above the rising 50-day MA, which remains positive.
Support is at 510.00, 500.00, and 485.00. Resistance is at 531.00, 535.00, and 540.00.
Daily MACD is on a buy, but momentum has not improved much. Weekly momentum has weakened, generating repeat sell signals. See the chart and other market charts here. Two closes below 510.00 would imply the risk of a pullback is increasing.
You can learn how to implement a powerful wealth-building mindset and charting strategies to help you grow wealth in the comfort of your home. Learn more in my eCourse Wealth Through Investing Made Simple here.
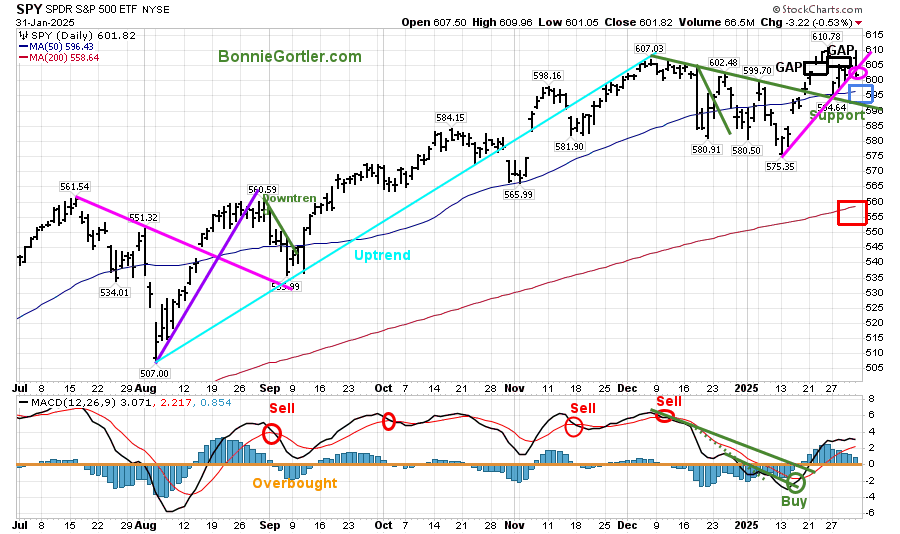
Figure 11: SPY Daily and 12-26-9 MACD (Bottom)
013125 SPY Daily
Source: Stockcharts.com
The S&P 500 (SPY) stalled last week, closing at 601.82, down -1.01%, breaking the uptrend (pink circle) from January 2025 (pink line). Both gaps were filled last week. (black rectangle). The SPY closed below 607.00 and 603.00 support mentioned in the 1/24/25 market update.
Support is at 595.00, 587.00, and 575.00,. Resistance is at 610.00. Two closes above 610.00 will likely trip the buy stops, propelling the SPY higher, while two closes below 595.00 will increase selling pressure towards support at 587.00 and 575.00.
Summing Up:
The recent rally stalled on Friday after an announcement about tariffs. The market reversed and finished lower. Day-to-day volatility increased last week and could continue as there are more earnings announcements, tariff concerns, and other unknowns. Short-term technical patterns are no longer oversold, and many intermediate momentum patterns show declining momentum, which is troubling and bears watching. If selling pressure on Technology and Semiconductor stocks continues, support levels break, and market breadth deteriorates, the risk of a pullback increases.
Let us get to know each other better. If you have any questions or want to explore charts together, contact me at Bonnie@Bonniegortler.com.
If you like this market update, you will love my free Charting Charting Master Class. Sign up HERE.


Create more wealth in your life
with these simple strategies.
As an added bonus you will also
receive BG’s Updates and Ezine

Discover how to quickly create more well-being in your life with these simple strategies.
As an added bonus you will also
receive BG’s Updates and Ezine

As an added bonus you will receive BG’s Updates and Ezine

All work listed on BonnieGortler.com is licensed under a Creative Commons Attribution - Noncommercial - No Derivative Works 3.0 Unported License.
