Bonnie’s Market Update 12/6/24
Bonnie’s Market Update 12/6/24
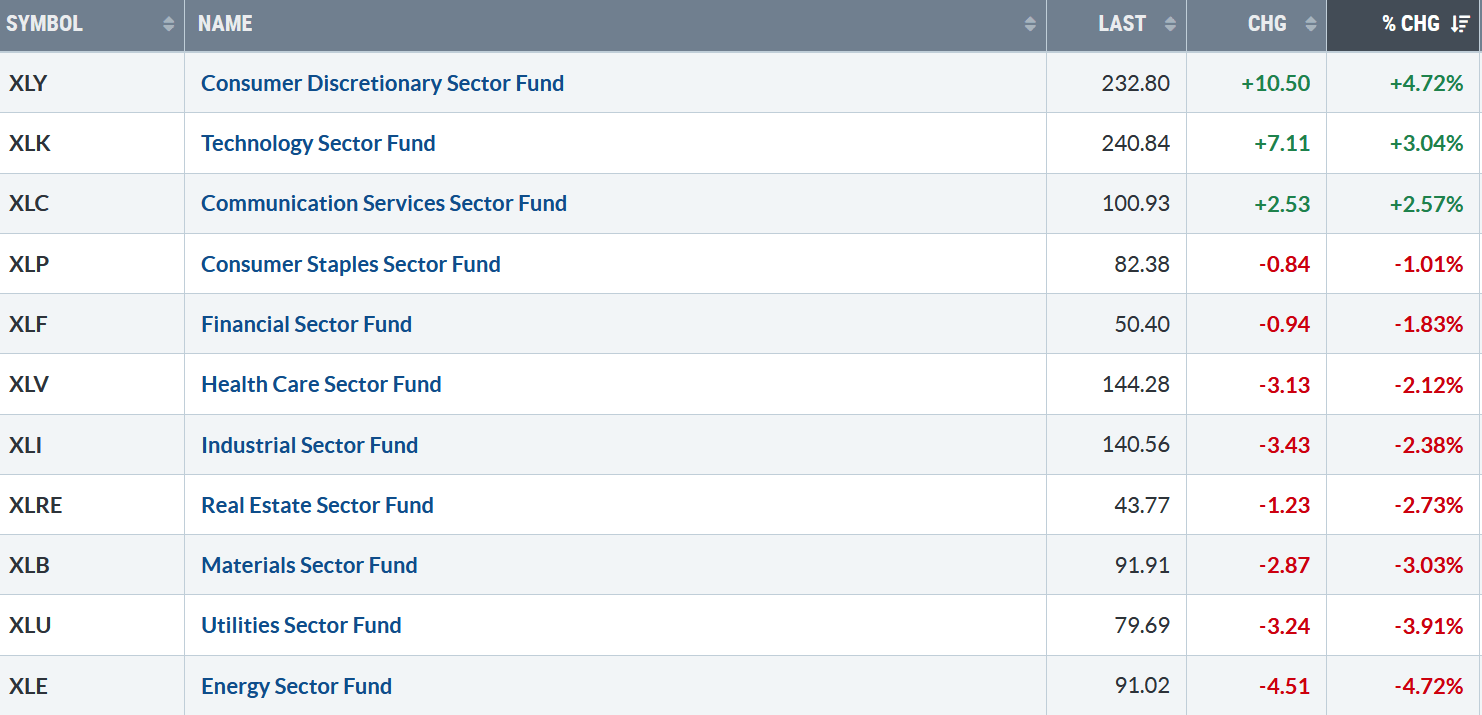
Friday closed at a new closing record high for the Nasdaq and S&P 500. However, only three of eleven S&P SPDR sectors were higher last week. Consumer Discretionary (XLY), Technology (XLK), and Communication Services (XLC) were the leading sectors, while Utilities (XLU) and Energy (XLE) were the weakest sectors. The SPDR S&P 500 ETF Trust (SPY) rose +0.87%.
S&P SPDR Sector ETFs Performance Summary 11/29/24 – 12/06/24
Source: Stockcharts.com
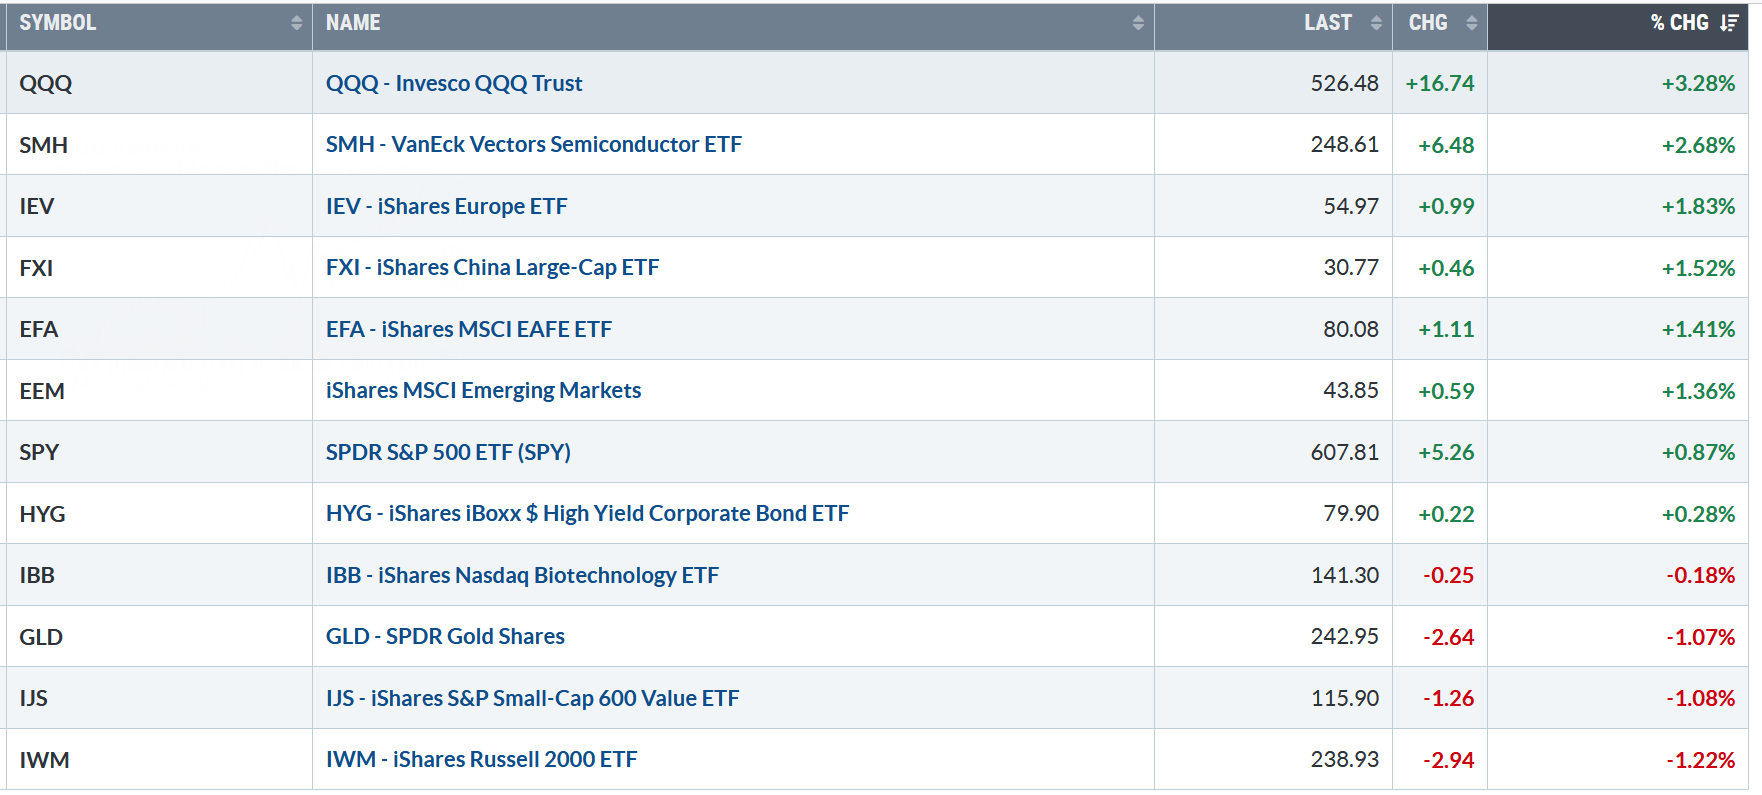
Figure 2: Bonnie’s ETFs Watch List Performance Summary 11/29/24 – 12/06/24
Source: Stockcharts.com
Technology, Semiconductors, and Europe led, while Small Cap Growth, Small Cap Value, and Gold lagged.
You can explore Bonnie’s market charts from last week and more HERE.
Charts to Watch:
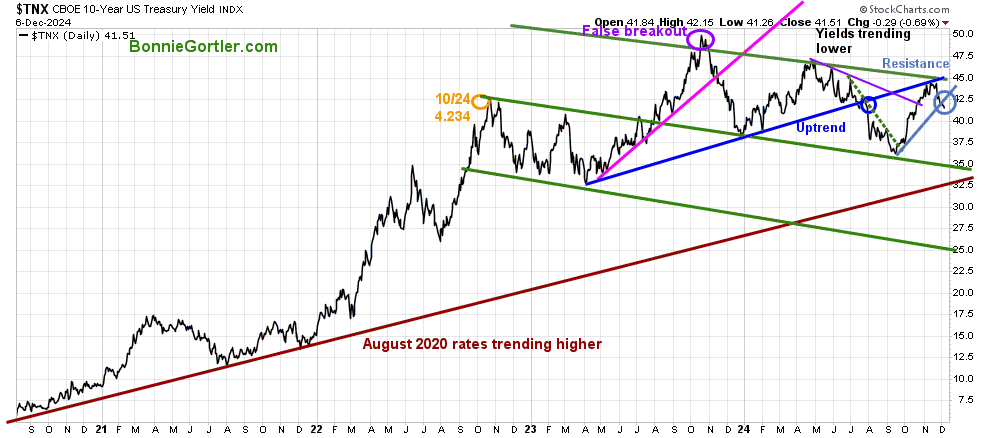
Figure 3: UST 10YR Bond Yields Daily
The 10-year U.S. Treasury declined last week, closing at 4.15, and continued to trend down after failing to get above resistance.
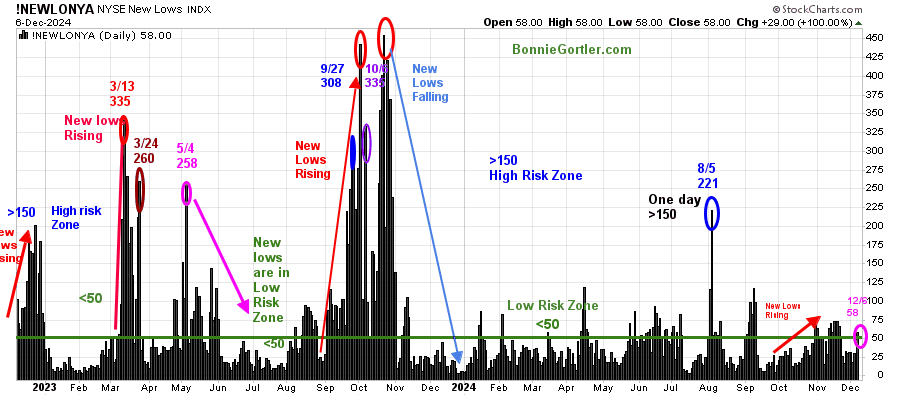
Figure 4: NYSE New Lows
Source: Stockcharts.com
New Lows on the NYSE upticked last week but remain in a low-risk zone, closing at 58 (pink circle) on 12/07/24.
Learn more about the significance of New Lows in my book, Journey to Wealth, published on Amazon. If you would like a preview, get a free chapter here.
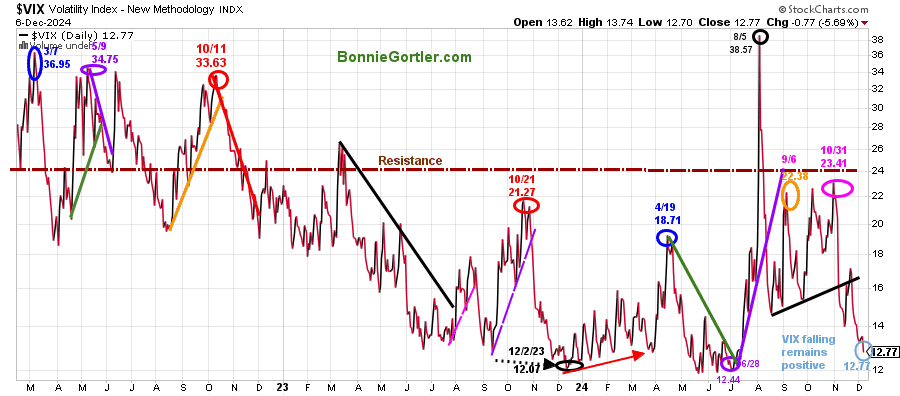
Figure 5: CBOE Volatility Index (VIX)
Source: Stockcharts.com
The CBOE Volatility Index (VIX), a measure of fear, fell last week, closing at 12.77 (blue circle), a low reading and falling, which is positive.
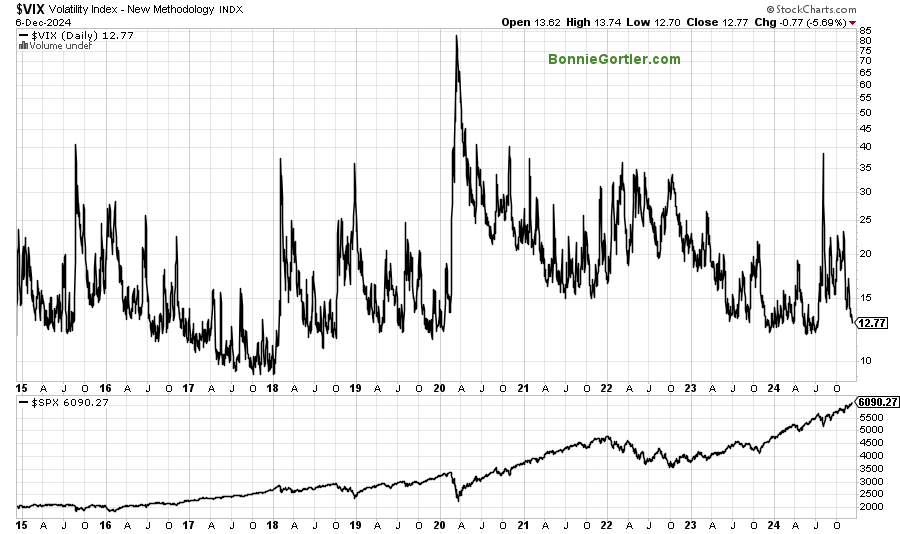
Figure 6: CBOE Volatility Index (VIX) 2015 and S&P 500
Source: Stockcharts.com
A longer-term perspective of VIX with the S&P 500 Index.
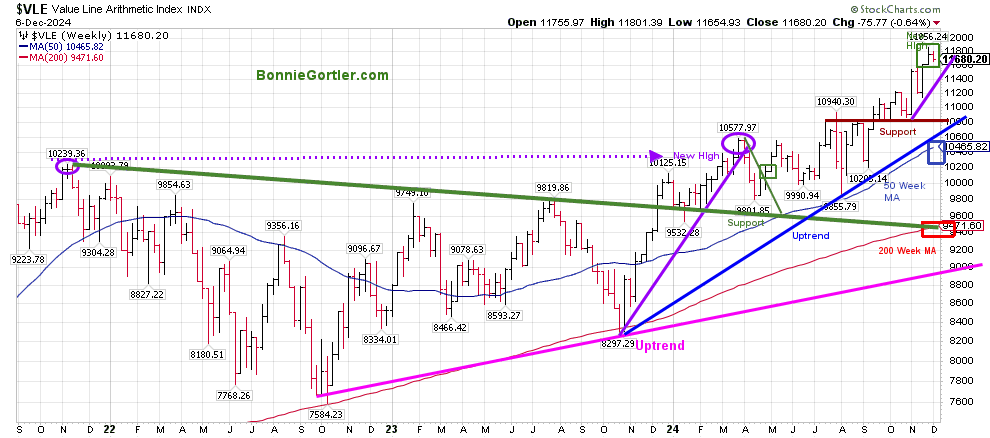
Figure 7: Value Line Arithmetic Average
Source: Stockcharts.com
The Value Line Arithmetic Index ($VLE) is a mix of approximately 1700 stocks.
VLE uptrend from October 2022 and October 2023 remains in effect. However, VLE did not make a new high last week, but it has remained in an uptrend since October. VLE closed above the 50-week MA, which is rising (blue rectangle), and the 200-week MA (red rectangle), a sign of underlying strength.
Support is 11600, 10800, followed by 10400. It would be positive if VLE holds support and closes above the 11/25 high at 11856.24.
Warning: Small Caps Momentum is Weakening
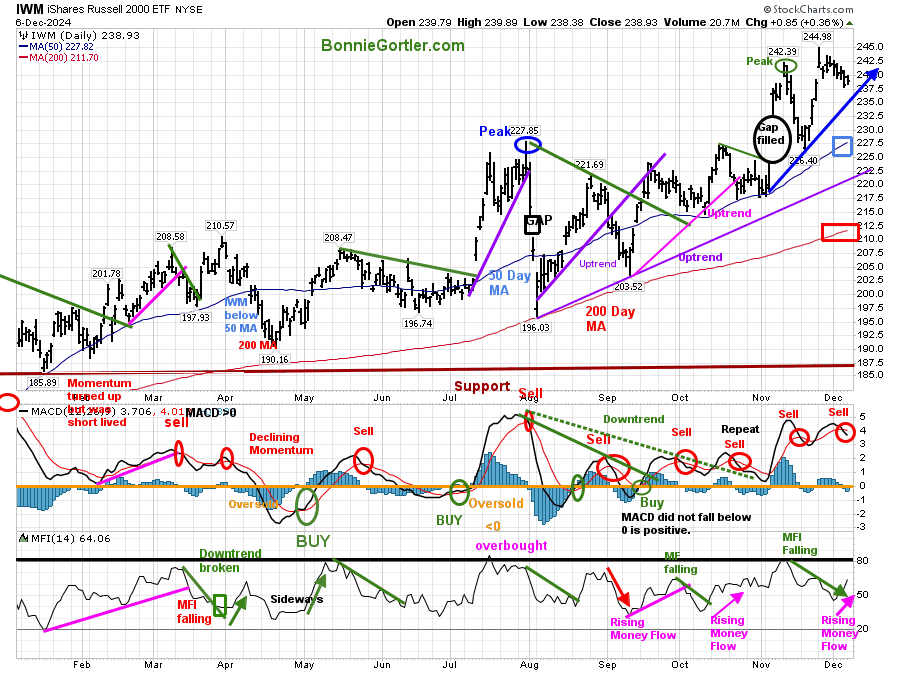
Figure 8: Daily iShares Russell 2000 (IWM) Price (Top) and 12-26-9 MACD (Middle) and Money Flow (Bottom)
Source: Stockcharts.com
The top chart is the daily iShares Russell 2000 Index ETF (IWM), the benchmark for small-cap stocks, with a 50-Day Moving Average (M.A.) (blue rectangle) and 200-Day Moving Average (M.A.) (red rectangle) that traders watch and use to define trends.
It’s positive that IWM remained in its short-term November uptrend, and the Money Flow (bottom chart is rising. However, momentum, as shown by MACD, is weakening, and bears are watching.
Strength closing above the high made on 11/25/24 of 244.48 would be positive.
Are you interested in learning more about the stock market? Learn how to implement a powerful wealth-building mindset and simple, reliable strategies to help you grow your wealth in my eCourse Wealth Through Investing Made Simple. Learn more here.
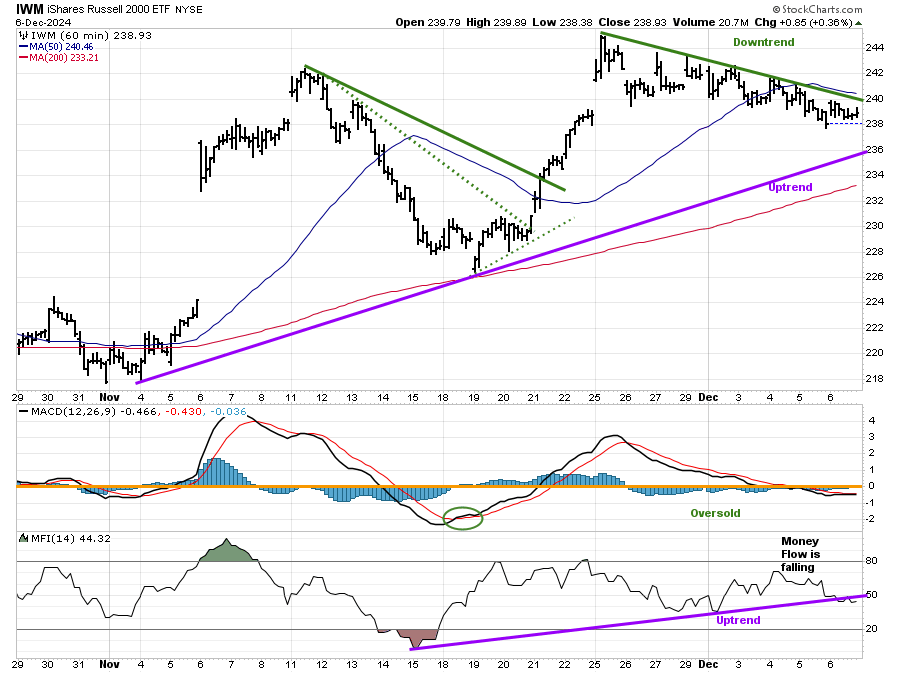
Figure 9: 60-Minute iShares Russell 2000 (IWM) Price (Top) and 12-26-9 MACD (Middle) and Money Flow (Bottom)
Source: Stockcharts.com
The hourly downtrend in Russell 2000 from November 25 remains.
However, it’s positive that the hourly uptrend has been in effect since November 4.
Two hourly closes above 241.27 will break the downtrend and shift the trend to up. On the other hand, two hourly closes below 235.77 would be negative, breaking the uptrend.
I want to see the IWM outperform the S&P 500 by more than it did today – 12/6/24 ~Bonnie Gortler (Posted in my Free Facebook group).
You are invited to join. Learn more here: Wealth Through Market Charts.
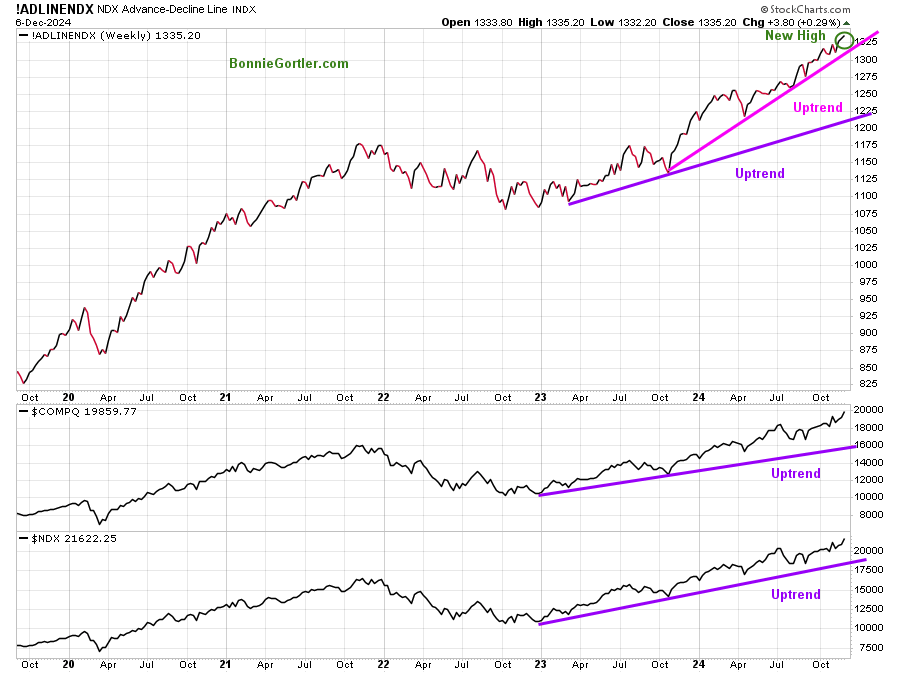
Figure 10: Nasdaq Advance Decline line (Top) Nasdaq Composite (Middle) Nasdaq 100 (Bottom)
Source: Stockcharts.com
The uptrend remains for the intermediate term for the NDX Advance Decline Line, Nasdaq Composite, and NDX Index.
The bulls continue to get the benefit of the doubt as long as the uptrends remain intact. However, be alert for a potential correction to begin when the uptrends break.
You can explore Bonnie’s market charts from last week and more HERE.
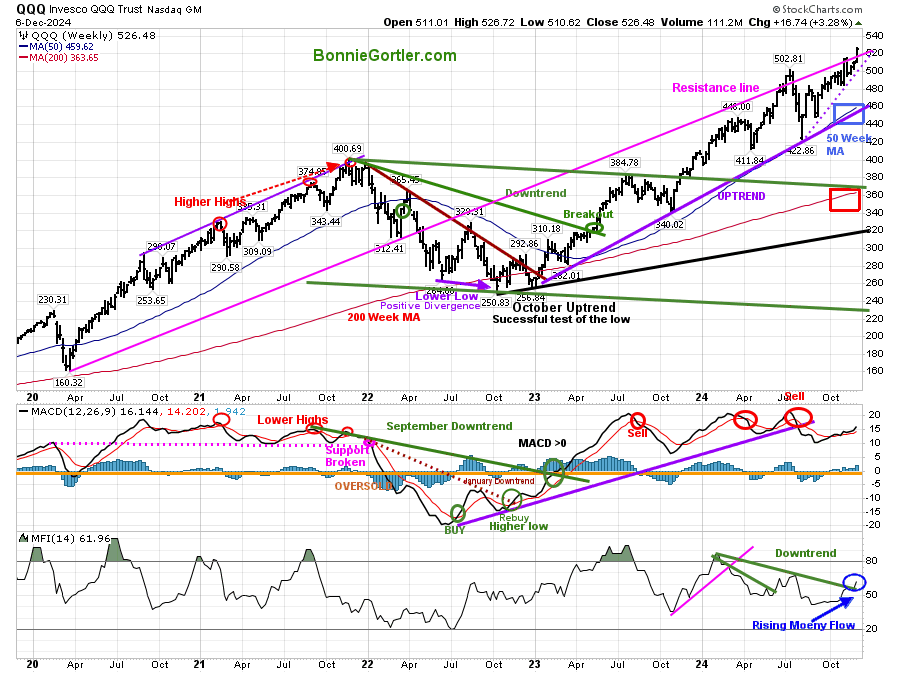
Figure 11: QQQ Weekly
Source: Stockcharts.com
It’s positive the QQQ intermediate uptrend from October 2023 remains intact.
QQQ was strong last week, gaining +3.28%, attracting buying as investors were willing to take on risk.
Short-term support is at 500, followed by 480.00 and 460.00. It’s a positive sign that the money flow is rising and has broken the 2024 downtrend. Keep an eye on the top holdings of QQQ, Apple (AAPL), NVIDIA (NVDA), Microsoft (MSFT), and Broadcom (AVGO), which make up over 30% to be a clue if the Nasdaq 100 (QQQ) will work its way higher or pause and digest its recent gains. Time will tell.
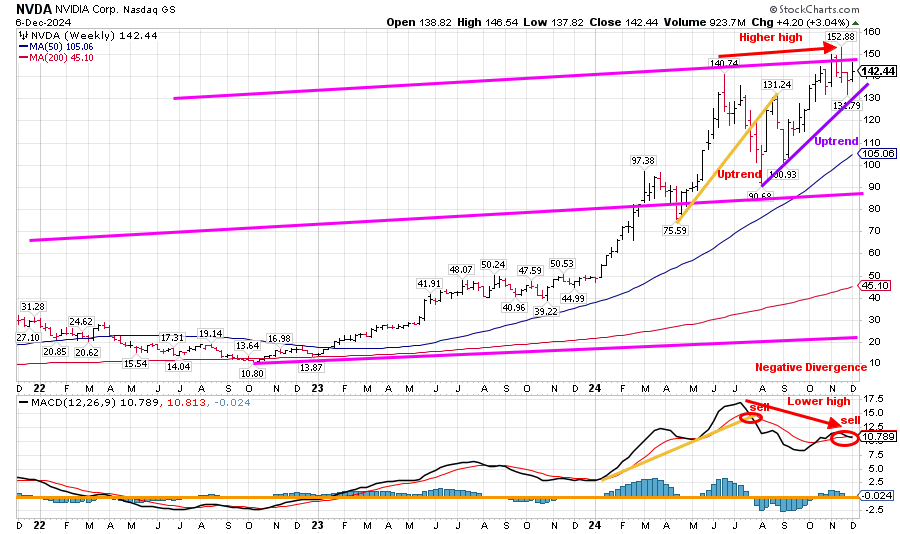
ALERT: Intermediate Negative Divergence Warning by NVIDIA Corp?
Figure 12: NVIDIA (NVDA) Weekly (Top) and MACD (Bottom)
Source: Stockcharts.com
Be alert to the actions of NVIDIA (NVDA), an investor favorite. MACD, a measure of momentum, is on a sell, has formed a negative divergence (a bearish pattern), and is a warning of potential weakness.
For more of Bonnie’s market charts, Click HERE.
Summing Up:
The Nasdaq Composite and S&P 500 made new record highs last week, ending the first trading week of December in positive territory, while the Dow declined. It’s a bit concerning market breadth was negative for the week, and the upside momentum stalled, with the S&P and Nasdaq at new highs. Be alert to a potential pause in the rally. It’s time to review your portfolios to ensure you are not overly exposed if and when volatility increases and support levels break, tripping sell stops. Manage your risk, and your wealth will grow.
Let us get to know each other better. If you have any questions or want to explore charts together, contact me at Bonnie@Bonniegortler.com.
If you like this market update, you will love my free Charting Charting Master Class. Sign up HERE.


