

5 Investing Strategies to Save Money and Grow Wealth
04/11/2024
Volatility has increased in equities. Investors keep rotating assets among different sectors as the major averages have been moving up and down within a fairly tight trading range. There has been some downside pressure in recent trading sessions after no breakout to the upside. In the forefront of investor’s minds is the election and speculation that the Fed will raise interest rates in December. Historically, October is a volatile month, yet profitable. So far this October it’s no different. The market made it through September unscathed. Time will tell if October can do the same.
There is weakening momentum on the intermediate and longer term charts of major averages such as the S&P 500, Russell 2000, and Nasdaq. Price trends are near or slightly below critical support levels as of this writing, specifically 212.00 on the S&P 500 (SPY) and 117.00 for the Russell 2000 (IWM).
Its early to tell if the most recent selling pressure is the start of something major, (I don’t believe this is so) or a decline that will be short lived and will be followed by another rally attempt towards the highs. One thing for sure, you can expect more volatility. Our models remain neutral, however likely to turn more bullish, as the month comes to a close, if no major decline occurs.
Health Care Select Sector SPDR ETF (XLV) Weekly (Top) and 12-26-9 Week MACD (Bottom)
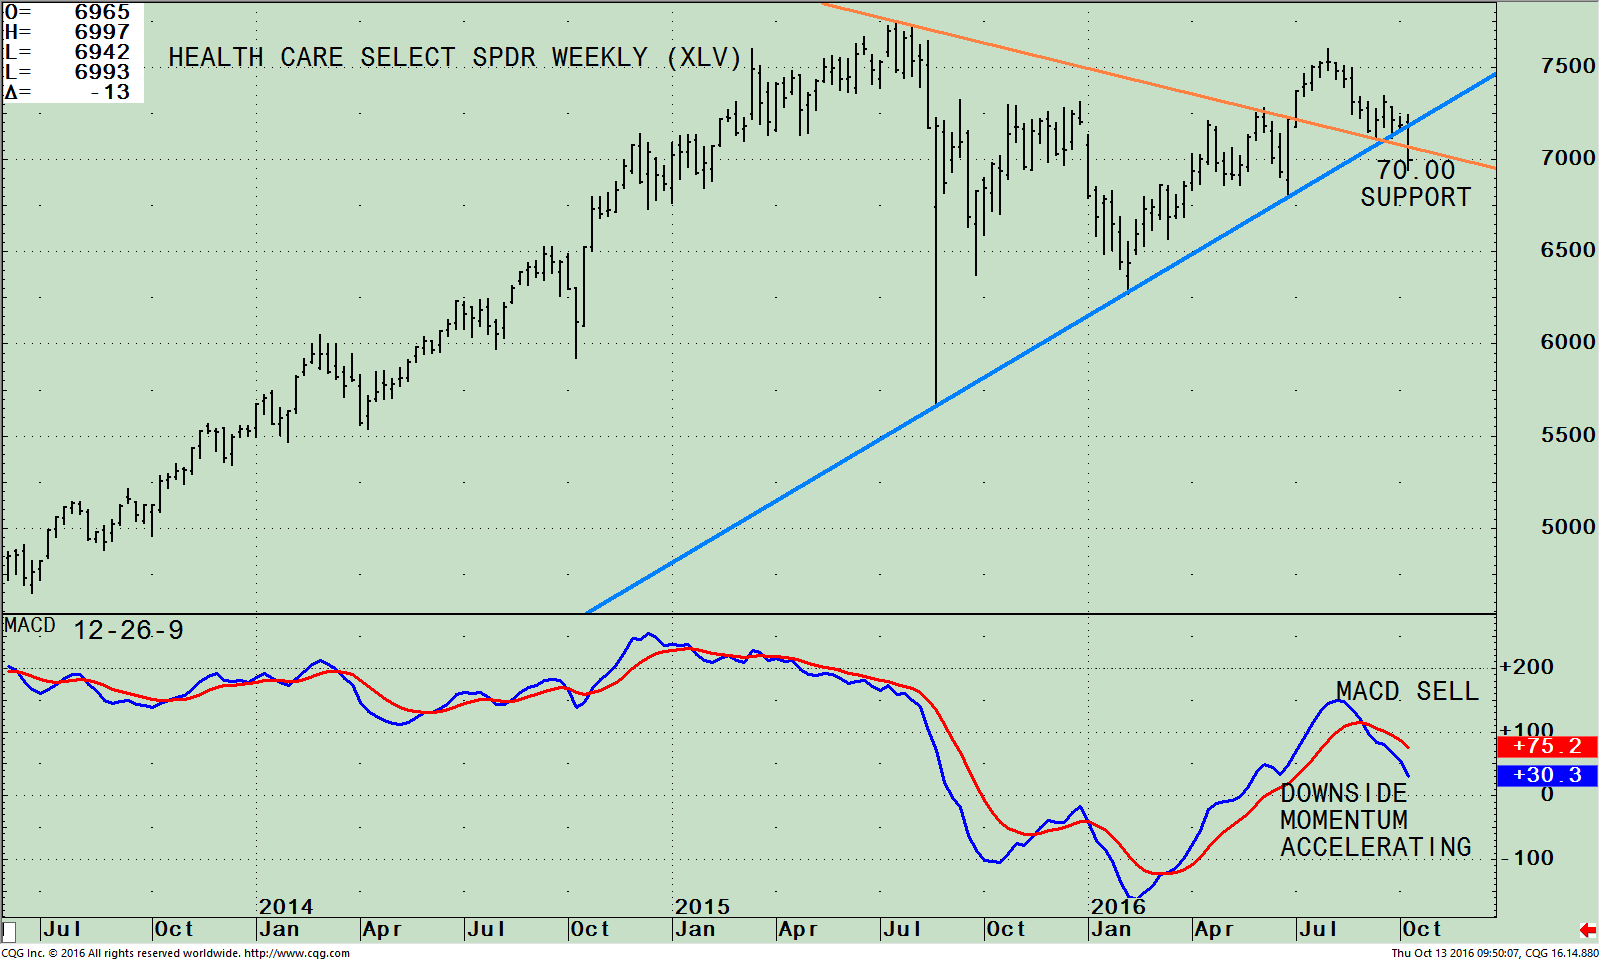
The chart above is the weekly Health Care SPDR (ETF) that is comprised of companies from industry groups including pharmaceuticals; health care providers & services; health care equipment & supplies; biotechnology; life sciences tools & services; and health care technology (*Zachs Research).
As of 10/11/16 the top 5 holdings in the XLV were Johnson and Johnson (11.84), Pfizer Inc. 7.37%, Merck & Co. 6.39%, United Health Group Inc. 4.79%, and Amgen Inc. 4.55%.
The XLV was in an intermediate uptrend from its low in July 2015. Health care stocks moved higher until the end of 2015, then weakened in early January, before beginning another advance. In June 2016, the XLV broke its downtrend (orange line) unable to surpass its 2015 highs. Subsequent weakness has followed. It looks to me like more downside is ahead. On 10/11/16 the XLV was under heavy selling pressure losing over 2% slightly penetrating the up-trendline (green line). This was after holding above support at 70.00 for 5 weeks. On 10/13/16 the XLV fell to a low of 69.42 intra-day. A bounce to 72.50 is possible, but looks to be more vulnerable to more selling. Next support is 60.00. The lack of strength on previous rallies does not bode well for the health care sector.
The bottom half of the chart shows MACD, a measure of momentum. MACD is on a sell, not yet oversold from where good buying opportunities develop. It’s bearish that MACD is falling and downside momentum is accelerating. This is not a good time to be over invested in health care. Caution is warranted.
Health Care Select Sector SPDR Fund (XLV) Monthly / (SPY) S&P 500 Index Ratio (Top), and 12-26-9 Week MACD (Bottom)
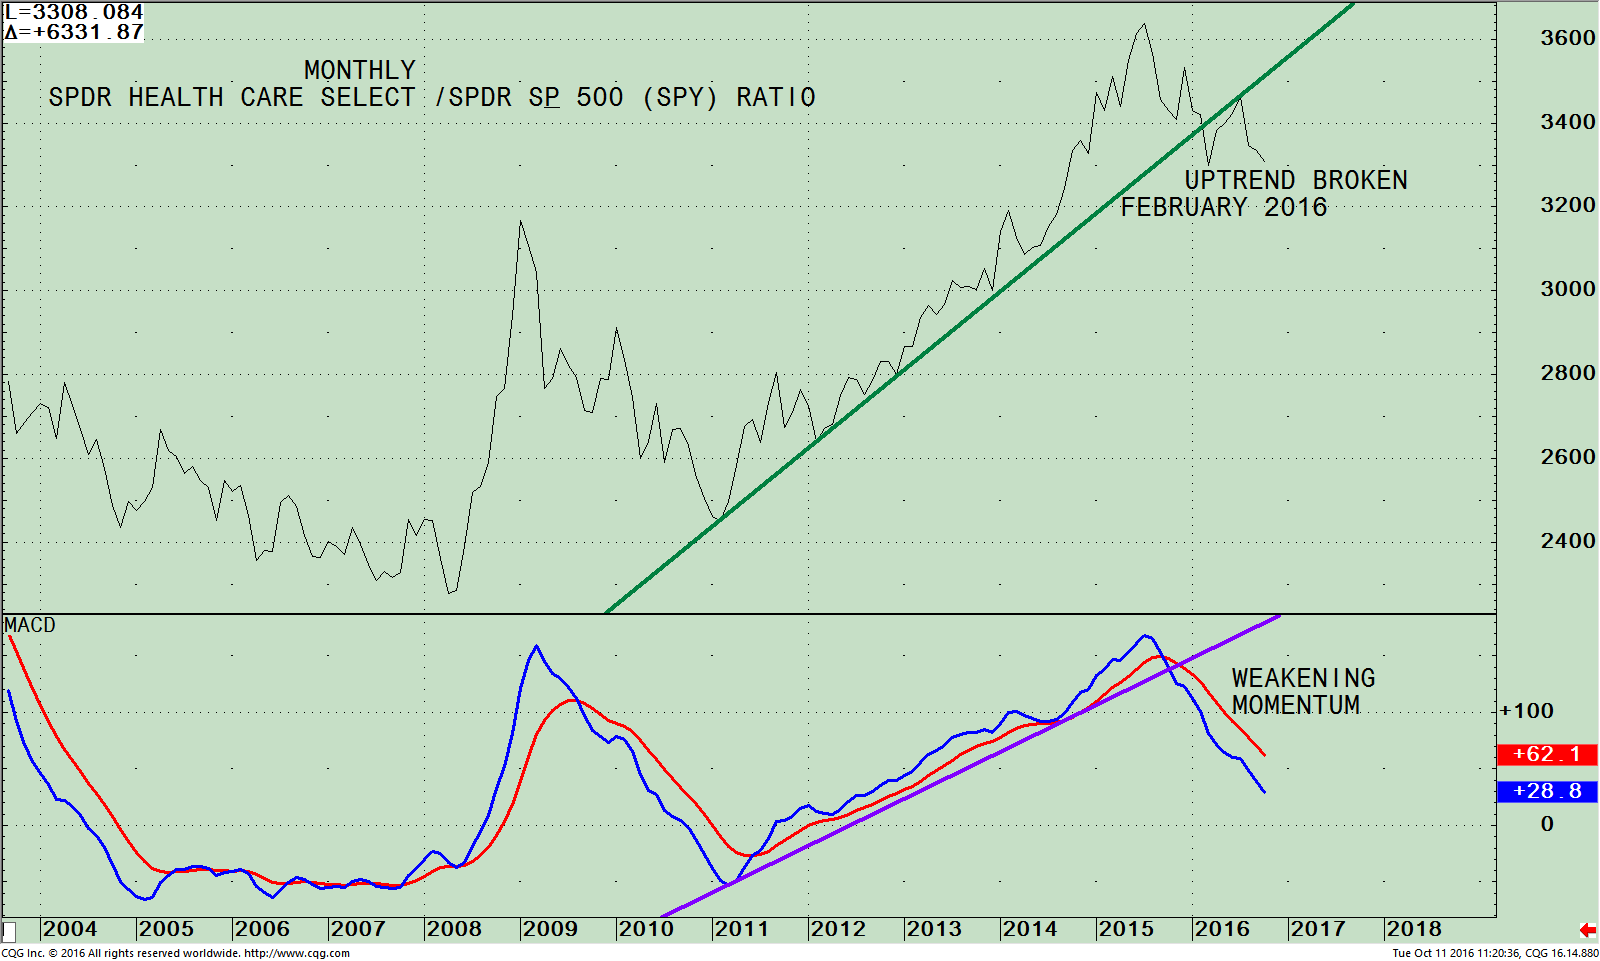
The chart above is the monthly Health Care Select Sector SPDR ETF /S&P 500 ratio (XLV /SPY). A rising line means the XLV is stronger, and if falling, the S&P 500 is stronger. The XLV/SPY ratio has been in a solid uptrend since 2011.
In July 2015, the (XLV/SPY) ratio peaked followed by a lower high made in December 2015, giving a warning of deteriorating momentum. A few months later, in February 2016, the uptrend from 2011 was broken (green line). Another rally attempt occurred, but failed to go through the downtrend line and now has turned down again, not a good sign.
Health care has been a very profitable long term investment. This year however it is not the case. XLV is down -1.6%, weaker than the S&P 500, (S&P) which is up 6.45% through 10/12/16 (including dividends). I am expecting it to be more of a challenge to make money in healthcare and experience continued under performance compared to the S&P 500 (SPY) going forward.
The bottom half of the chart shows MACD, on the (XLV/SPY) ratio. MACD generated a sell, turning down from an overbought condition, and its momentum is still weakening. There is no favorable bottoming formation in place. It will take many months before this type of pattern can develop.
Summing Up:
In the past few trading sessions a decline has begun after major averages have been moving up and down within a fairly tight trading range. Health care (XLV) is lagging the S&P 500 (SPY) not only for the month of October, but under performing for the year. The intermediate and long term trend is clearly down. No favorable patterns are in place at this time. Instead evidence shows that downside momentum is accelerating. Caution is advised. I am recommending reviewing your portfolio to be sure you are not overweight in health care. Stock selection will be very important as earning season is here, and any downside earnings surprises will not be forgiving.
In addition it bears watching to see if 212.00, the S&P 500 (SPY) support level that was violated intraday on 10/13/16, yet closed above, can hold. A close below 212.00 for two days would be a warning further decline is likely. For now I am giving the market the benefit of the doubt but I am a nervous bull with increased anxiety concerned by warning signals starting to form in intermediate and long term momentum indicators.
I would love to hear from you. Please call me at 516-829-6444 or email at bgortler@signalert.com to share your thoughts or ask me any questions you might have.
If you like this article, then you will love this!
Click here for a free report: Top 10 investing Tips to More Wealth
*******Article in Systems and Forecasts October 14, 2016

Discover the right wealth building attitude…
Download a Free chapter of my book Journey To Wealth
Disclaimer: Although the information is made with a sincere effort for accuracy, it is not guaranteed that the information provided is a statement of fact. Nor can we guarantee the results of following any of the recommendations made herein. Readers are encouraged to meet with their own advisors to consider the suitability of investments for their own particular situations and for determination of their own risk levels. Past performance does not guarantee any future results.


Create more wealth in your life
with these simple strategies.
As an added bonus you will also
receive BG’s Updates and Ezine

Discover how to quickly create more well-being in your life with these simple strategies.
As an added bonus you will also
receive BG’s Updates and Ezine

As an added bonus you will receive BG’s Updates and Ezine

All work listed on BonnieGortler.com is licensed under a Creative Commons Attribution - Noncommercial - No Derivative Works 3.0 Unported License.
