The stock market is off to a very rocky start in 2016, with the S&P 500, Dow and Nasdaq index all down over 9% from their highs. Our models have turned negative, meaning little profit potential with signifi cant levels of risk. There is a huge amount of pessimism and fear by investors that has caused heavy selling of stocks.
Intraday swings are getting larger instead of smaller, not a sign of a healthy market. Too much volatility!
Oil has moved sharply lower, below $30. Concerns about China’s growth, and extensive selling in the high yield space (which represents the lower credit quality issuers), have fueled the decline. Each time the market has tried to form a bottom in January and move higher, more selling materializes and lower lows on market averages have been made. The market has lost its momentum over the short and intermediate term. The trend is down. The bears appear to have taken over control from the bulls and this could last for some time. More and more stocks have joined in the recent down move, generating 1368 new 52-week lows on the New York Stock Exchange on 01/21/16, the most since November 2008. The small cap sector has been extremely weak, falling over 20% from its peak, not helping investors’ confidence in the overall market.
On the flip side, the market is due for a bounce at any time, given its short term oversold condition.The American Association of Individual Investors Sentiment survey shows the lowest amount of bulls in 11 years, a contrary indicator suggesting a market rally could occur sooner rather than later. If the market tape action were acting better, I would agree that now is a good buying opportunity, but I don’t think this is the case. With the shift in trend from bullish to bearish, bottom fishing is high risk. A safer entry will occur 3-6 weeks after the final low is in. If the market fails and the 01/20/16 lows are violated, another leg down is likely.
In last newsletter the big question was will the decline continue, or will the market turn up from here?The answer was revealed: the market declining sharply, unable to generate any positive signs for rally. Once again the market is at a critical point.
Here is a quick list to monitor for some clues the decline will pause and the selling pressure to subside.
• The Overseas markets start to rise. Keep an eye on Emerging Markets (EEM), China (FXI) and Europe (IEV) as benchmarks.
• Market breadth improves with a string of days that have more advancing stocks than declining stocks.
• You want to see when on up days volume increases, and on down days volume is lighter.
• Biotechnology (XBI) rises with the intraday trading swings narrowing forming a base.
• Apple (APPL) earnings on 01/26/16 are better than expected. It would also help if there are other positive earnings surprises by stocks.
• High yield bonds stop making new lows, become stable and turn up. Use HYG or JNK as a benchmark.
• Intraday day trading swings quiet down. Watch to see if VIX moves lower below 20.00 instead of rising above 30.00.
• Oil stops falling and moves higher. Watch (USO).
• Small caps (IWM) need to generate investors’ confidence to invest in the sector again. They are down
over 20% from their peak and lagging the S&P 500 (SPY). Watch to see if small caps can be stronger
than the S&P 500 (SPY). Als watch to see that the daily relative strength ratio IWM/SPY turns up.
• The S&P 500 (SPY) closes above 190.00 for at least two days showing firming tape action, which is a start, and then trying to break through the resistance above in the 195.00 area.
What Are The Charts Saying?
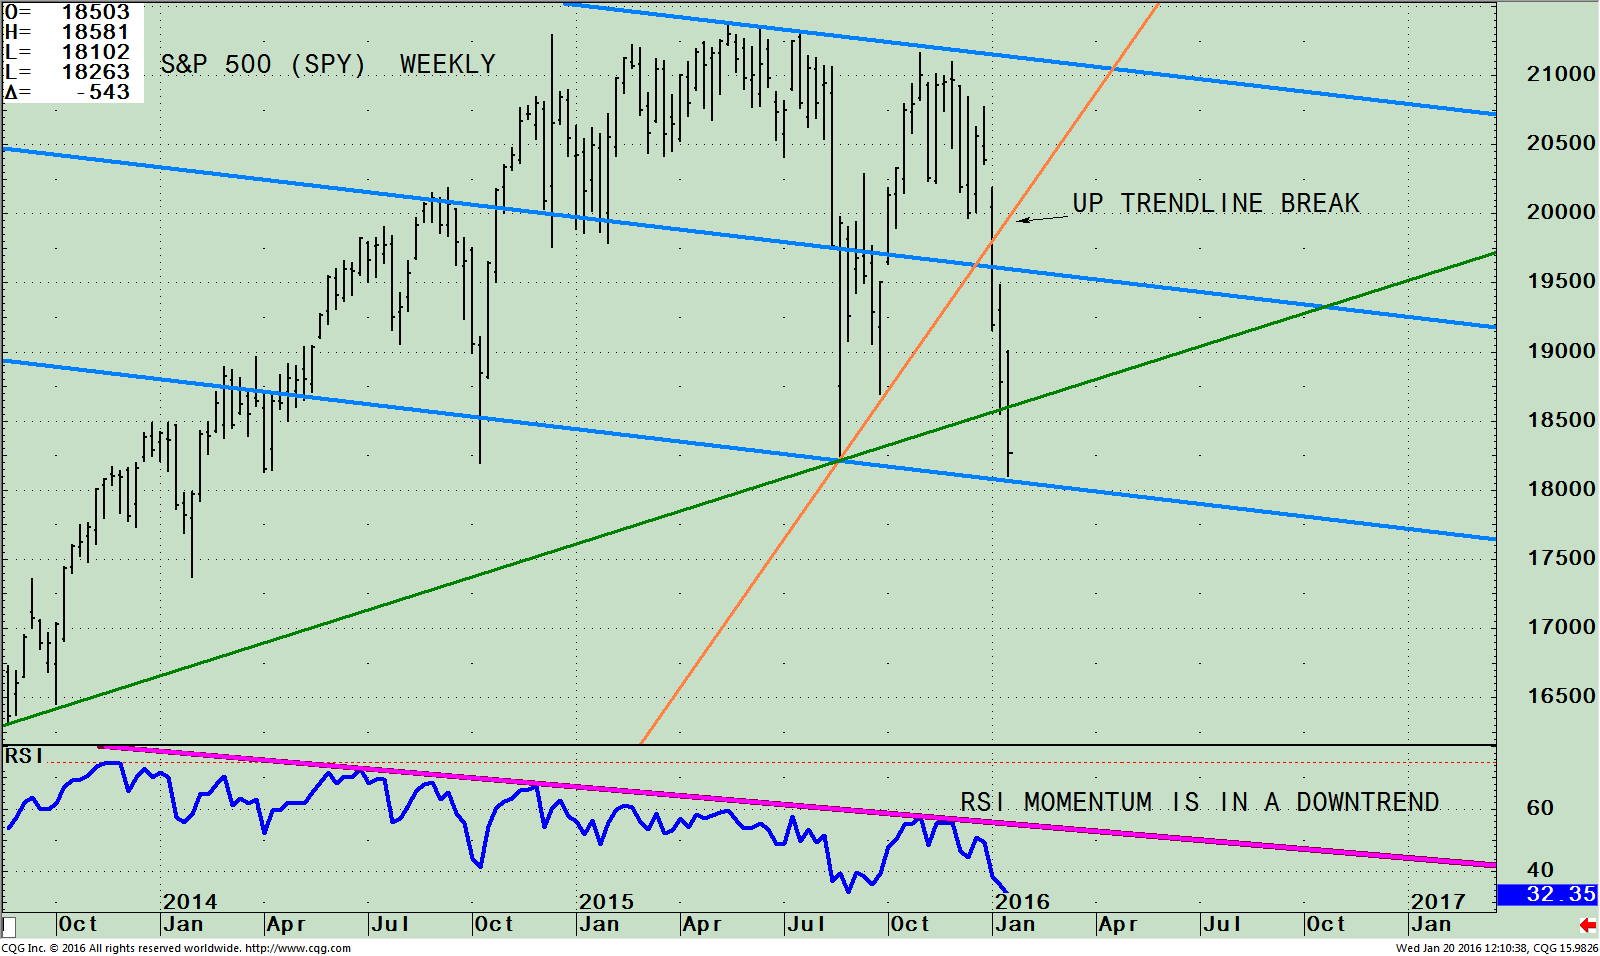
The SPDR S&P 500 (SPY) Weekly ETF With Channel (Top) and RSI14 (Bottom)

The top chart is the SPDR S&P 500 (SPY) ETF which is comprised of 500 stocks of the largest companies in the U.S. listed on national stock exchanges.
The above chart is updated since the last newsletter when the S&P 500 (SPY) was trading at 194.00 on 01/08/16, only 2 weeks ago. The S&P 500 (SPY) accelerated down, breaking the uptrend from July 2015 (orange line) and also breaking the uptrend from October 2013, (green line) shifting the intermediate trend to down. Now with the trend down, there is more risk. Be aware that it will be harder to make money from the long side.
Notice how after the uptrend was broken (the orange line), the middle channel (the blue line) didn’t hold support at around 195. At that point, the S&P 500 (SPY) accelerated lower towards the bottom of the channel at 180.00 (lower blue line). The low made on 01/20/16 at 181.02 could potentially be the low before a short term bounce takes place. If the S&P goes above 190.00 for two days, retesting from where the breakdown occurred, I will be more convinced that the recent decline is over. If today’s lows are violated another leg down is likely.
The bottom half of the chart is the Relative Strength Index, (RSI) a measure of momentum developed by Welles Wilder. RSI is based on the ratio of upward price changes to downward price changes. RSI clearly showed weakening momentum (pink line) before the decline accelerated and now there is no turn up or positive divergence in place, suggesting the bottom is in. Therefore patience is recommended.
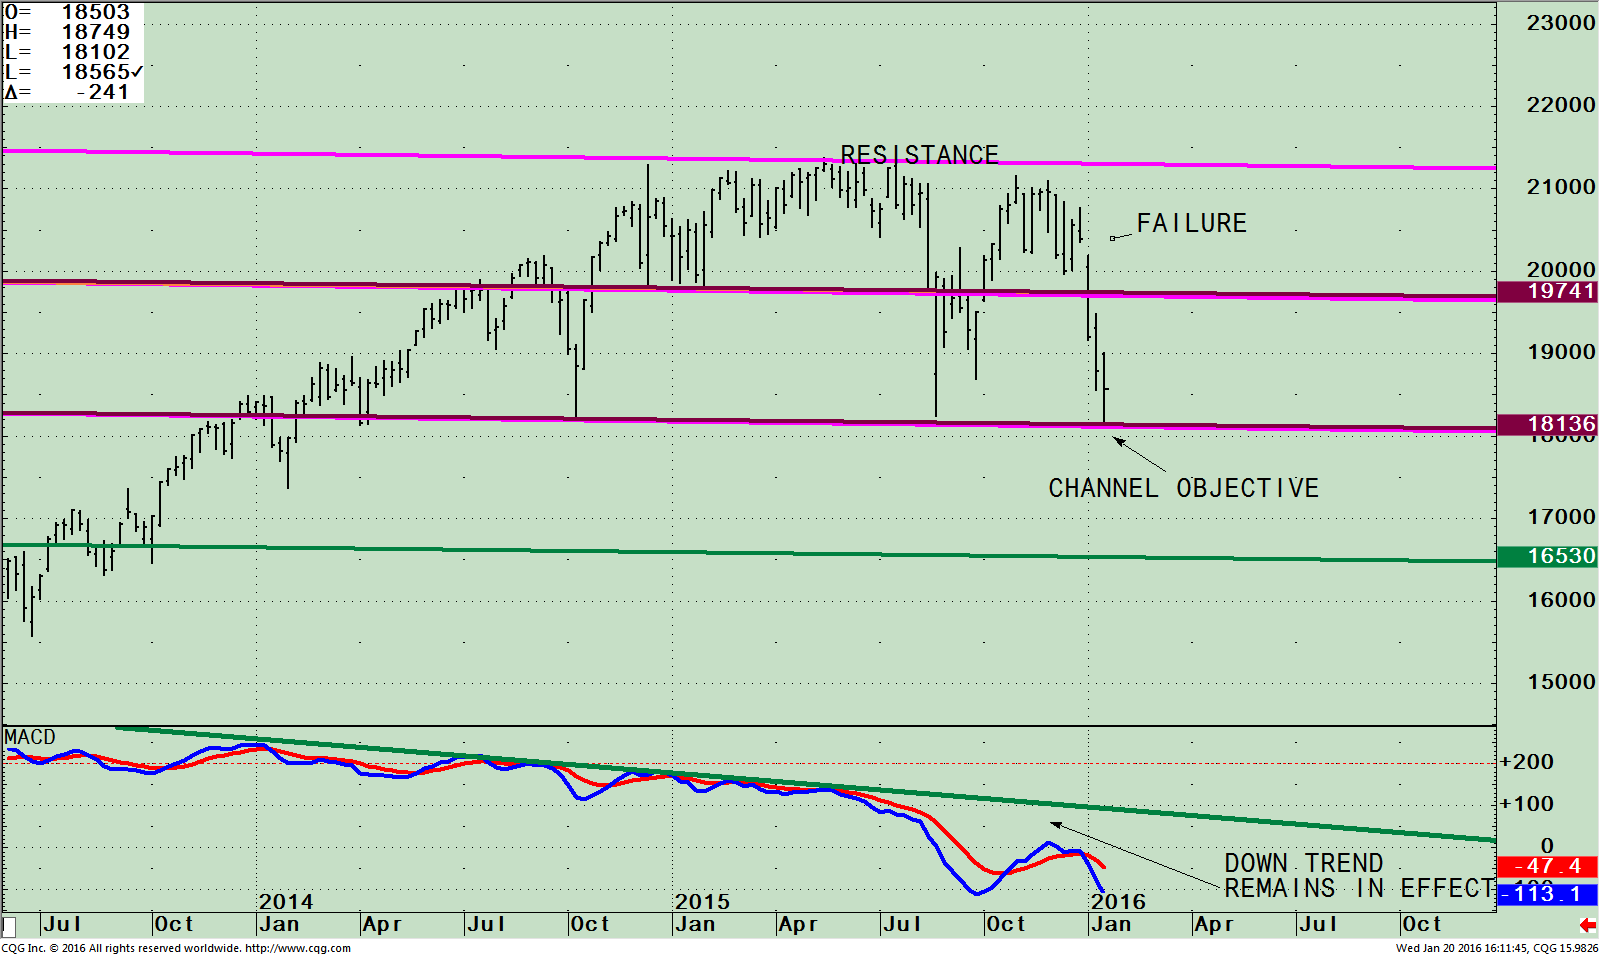
The SPDR S&P 500 (SPY) Weekly ETF With Channel (Top) and MACD (Bottom)

The chart above also is the weekly chart of SPDR S&P 500 (SPY) ETF. The S&P 500 (SPY) decline stopped at a very significant area, the downside channel objective for the decline. The S&P 500 (SPY) reversed off of its low on 1/20/16 to close at 185.65, unable to break even for the day, but enough of a rally to give some hope that a turn might take place.
The other scenario that could occur is that the S&P stalls, and starts to decline again. The lows are penetrated and another leg down to the lower channel (green line) will take place. There is no support below so the decline could accelerate fast as investors begin to throw in the towel. The lower channel is at 165.00, more than 10% lower.
The lower chart is MACD, an indicator that measures momentum. The trend remains down. In the previous rally when the S&P stalled at resistance, MACD was unable to break the downtrend, and was clearly showing weakening momentum. Now, MACD is in better shape than late last year, oversold and a favorable-looking pattern has spread, over about 17 weeks. If the S&P can turn up, this would be a good sign of a potential shift change to a more favorable climate. Time will tell. If MACD doesn’t turn up, then many more weeks will be needed for a positive pattern to develop. More time is needed for a clear safe buying opportunity. Patience is recommended instead of buying prematurely.
Summing Up:
The stock market trend is clearly down. The S&P fall stopped at a very important key channel where the buyer stepped in. There is no doubt that the equity markets have had a correction, but if the lows on 01/20/16 don’t hold there is a good chance the bull market has ended and a bear market has started. Caution is advised and patience is necessary. The trend is down. Cash is king. Watch for improving tape action and our models to signal less risk before bottom fishing.
Call me with any comments, feedback or questions at 516.829.6444 or email bgortler@signalert.com
*******Article in Systems and Forecasts January 22, 2015


