
Bonnie’s Market Update 12/27/24
12/29/2024
The roller coaster ride continues in March as the struggle against COVID-19 coronavirus pandemic continues. An enormous rescue package by Congress passed late last week, which sparked one of the most impressive rallies in decades after record-setting losses in stocks. For example, in three days, the Dow recovered +21% after losing -17.3% the previous week. However, the bears regained control on Friday, March 27, with the major averages falling sharply as investors and institutions sold into the rally. There is a high probability that institutions could decide to sell more of their investment holdings for the end of the 1st quarter rebalancing to raise cash for liquidity purposes.
Stock market volatility remains high with the CBOE Volatility Index (VIX), closing at 65.54. VIX (a measure of fear) is likely to continue over the next several weeks at a minimum. For the week, the S&P 500 gained +10.26% after falling -14.98%, the Dow finished up +12.84% after losing -17.3%, and the Nasdaq finished up +9.05% after losing -12.64%. Be prepared for more large intraday swings ranging from 5-10% counting overnight trading, which seems to be much more active than in recent years.
Where do we go from here from a charting perspective? Watch the tape for strength or weakness in Technology.
Figure: Daily Invesco QQQ Trust Nasdaq (QQQ) Price (Top) and 12-26-9 MACD (Bottom)
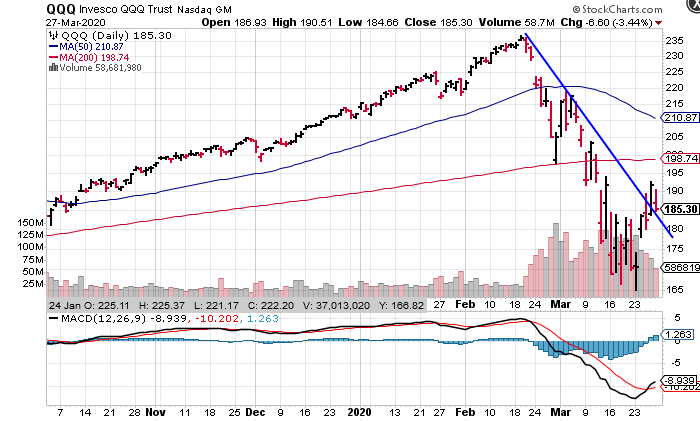
The top part chart shows the daily Invesco (QQQ)1, an exchange-traded fund based on the Nasdaq 100 Index with its 50-Day Moving Average and 200-Day Moving Average (***See below for top holdings).
The rally broke the downtrend shifting the short-term trend to positive. The rally generated a MACD buy signal (lower portion of the chart). Many times, after a significant thrust down, creating a very oversold condition, the first buy fails. A safer entry would be a double bottom formation or a positive divergence. On the other hand, it’s not positive QQQ remains below the 50- Day MA at 210.87 and the 200-Day MA at 198.74. QQQ closed at 185.30.
Figure 2: Weekly Invesco QQQ Trust Nasdaq (QQQ) Price (Top) and 12-26-9 MACD (Bottom)
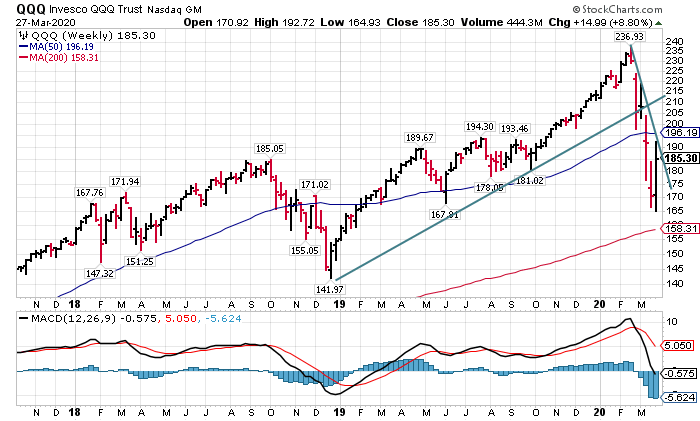
Charts Stockcharts.com (3/27)
The top part chart shows the Weekly Invesco (QQQ). The intermediate chart pattern remains in a weekly downtrend and is below its 50-week moving average (MA) (185.30). I recommend patience as well as close stops before getting too aggressive buying now. During October 2008, MACD buy signals that generated were early. The ultimate market bottom was reached several months later.
I recommend keeping an eye on the top holdings in the QQQ (see below***) as a hint which way the QQQ will go from here. The top two holdings of QQQ, Microsoft (MSFT), and Apple (AAPL) closed above their 50-Week Moving Average. However, if they close below 144.59 and 239.91 respectively, I would expect more selling in QQQ to occur in the near term and a potential test of the March 20 low.
In Sum
With the downside thrust in March, high daily volatility, and the uncertainty about the coronavirus, I remain skeptical the decline is complete. Until at least the intermediate trend turns positive risk remains high.
1The QQQ includes 100 of the largest domestic and international nonfinancial companies listed on the Nasdaq. As of 3/27/20, the top holdings are Microsoft Corp (MSFT) 11.62%, Apple (AAPL) 11.31%, Amazon.com Inc. (AMZN) 9.69%, Alphabet Inc. Class C (GOOG) 3.93%, Alphabet Inc. Class A (GOOGL) 3.93%, Facebook Inc. Class A (FB) 3.90%, and Intel Corp (INTC) 2.95%, totaling 47.33. Source: https://www.etf.com/QQQ#overview
“The best investment you can make is an investment in yourself… The more you learn, the more you will earn. “ ~Warren Buffet
With all that is going on in the world, your self-care is essential.
Here are some tips for your self-care:
If you like this article, you will love a free 30-minute Wealth and Well-Being strategy session with me.
Disclaimer: Although the information is made with a sincere effort for accuracy, it is not guaranteed that the information provided is a statement of fact. Nor can we guarantee the results of following any of the recommendations made herein. Readers are encouraged to meet with their own advisors to consider the suitability of investments for their own particular situations and for determination of their own risk levels. Past performance does not guarantee any future results.


Create more wealth in your life
with these simple strategies.
As an added bonus you will also
receive BG’s Updates and Ezine

Discover how to quickly create more well-being in your life with these simple strategies.
As an added bonus you will also
receive BG’s Updates and Ezine

As an added bonus you will receive BG’s Updates and Ezine

All work listed on BonnieGortler.com is licensed under a Creative Commons Attribution - Noncommercial - No Derivative Works 3.0 Unported License.
