

5 Investing Strategies to Save Money and Grow Wealth
04/11/2024
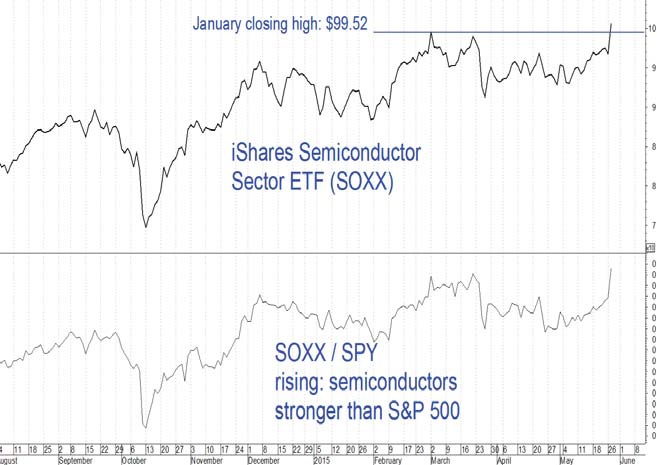
A possible breakout to the upside in US equity averages failed once again in the past week. However, the S&P 500 has almost recovered from its recent losses with a potential key reversal day to the upside on 05/27/15. The technology sector, represented by PowerShares QQQ (QQQ, tracking the Nasdaq 100 Index) is acting better. The semiconductors (see chart of SOXX below) are strong, showing leadership, already penetrating January’s high which is bullish for the technology sector and good for the overall health of the stock market.
Power Shares QQQ Daily Price and Trend Channels (Top), and 12-26-9 Daily MACD (Bottom)
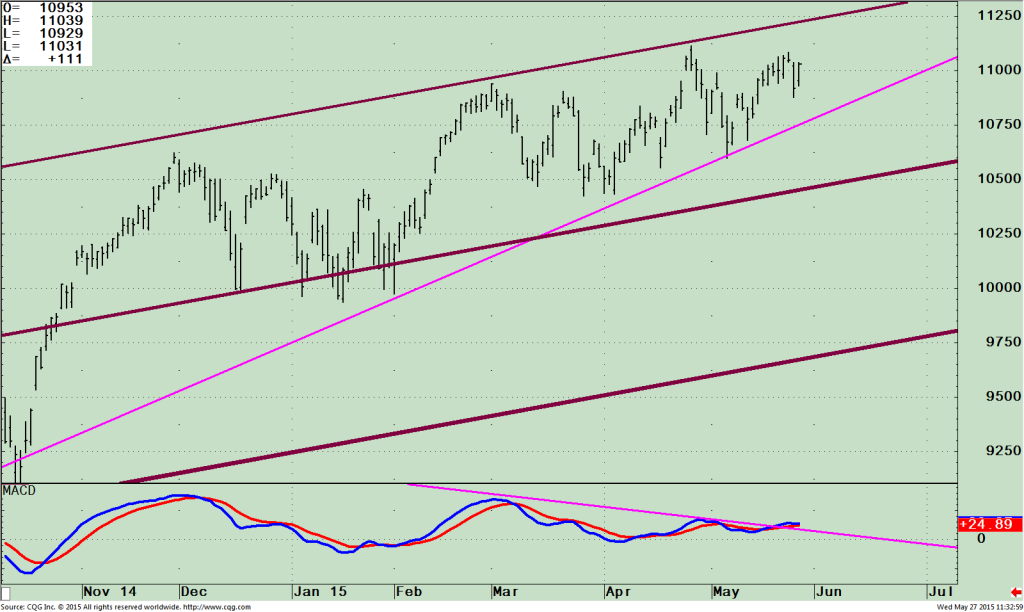 The top part of the chart is the Power Shares QQQ Trust; an exchange traded fund (ETF) based on the Nasdaq 100 Index. The Index includes 100 of the largest domestic and international nonfinancial companies listed on the Nasdaq Stock Market based on market capitalization. As of 5/26/15, Apple, (AAPL) is the largest holding comprising 14.61% and Microsoft Corp (MSFT) is the second largest holding at 7.40%. Both stocks peaked in late April, like the QQQ, but their present chart patterns appear favorable supporting higher prices for the QQQ. The top portion of the chart above shows how the QQQ has been unable to get through the top of the short term daily channel. Each time it was near, prices turned down. A closing price above for two days would be considered a breakout. Resistance now is at 112.50, with the uptrend since October 2014 (pink line) in effect. First support is at 107.50. A break below would suggest prices could quickly fall to the lower daily channel at 105.00 followed by 97.00. The lower portion of the daily QQQ chart is MACD, a momentum oscillator. When it is above 0 and rising, it indicates increasing momentum. There is also a slight upside break in the downtrend from March (Pink line) that has positive short term implications.
As long as QQQ is above 107.50, look for higher prices. Power Shares QQQ Weekly Price and Trend Channels (Top), and RSI 14 (Bottom)
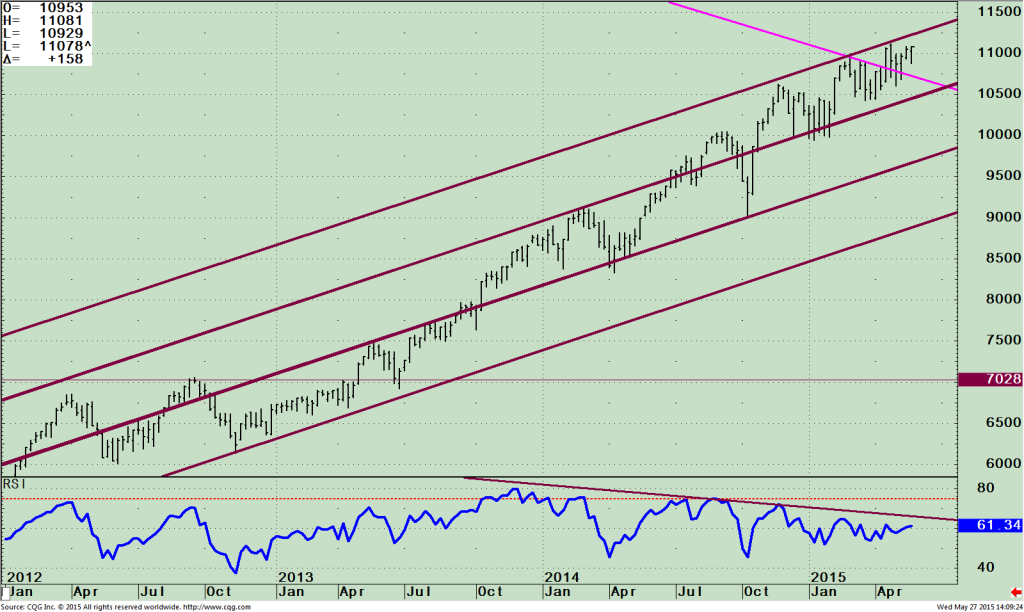 The top portion of the weekly QQQ chart (to the right) also shows how QQQ for the intermediate term has stopped rising when price is near or at the top of the channel. QQQ remains above its recent breakout to the upside (pink line). The top channel objective is 112.50, the same area of resistance as the daily chart. When the QQQ moves through the resistance level, the next objective is 124.00. The lower portion of the chart is the Relative Strength Index, (RSI 14), a momentum indicator developed by Welles Wilder. It would be bullish, confirming higher prices ahead if the downtrend is broken. It is now very close to breaking the trend line from July 2014. If broken, expect further strength that could be could be sharp and fast, potentially triggering any buy stops that investors could have in place. Watch the indicator to see how high the reading gets before it turns down. If the RSI could get to 70 or above it should buy more time for the bull market environment: A secondary test of the price highs in QQQ would most likely happen before a major top would be in place.
Monthly QQQ/SPY Ratio (Top) RSI of QQQ/SPY Ratio (Bottom)
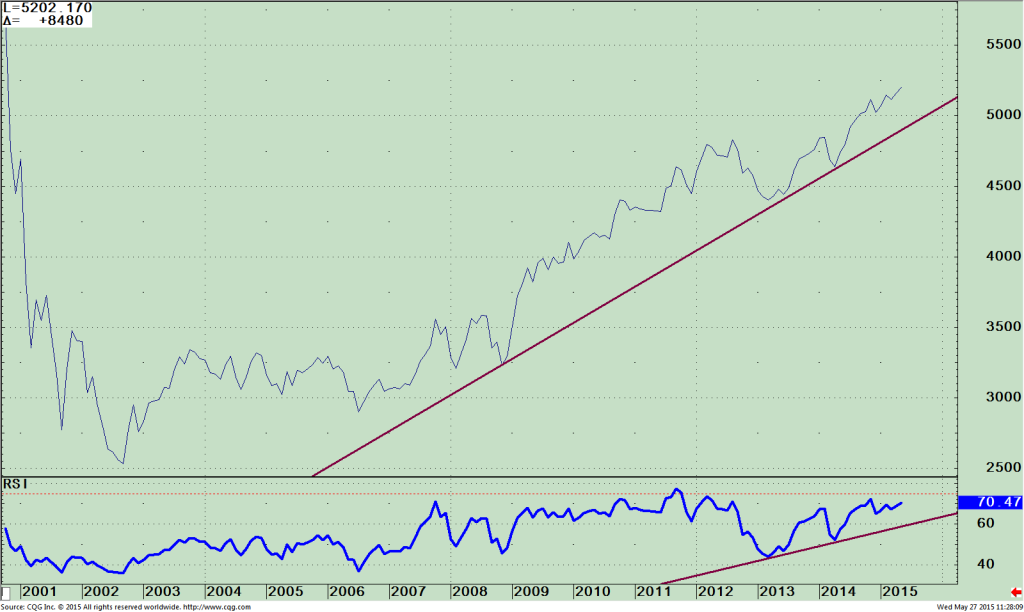 The top part of the chart is the monthly ratio QQQ/SPY ratio. A rising line means the Nasdaq 100 is stronger and if falling, the S&P 500 is stronger. With the line continuing to rise, this confirms the long term strength in the QQQ vs. the S&P, which normally bodes well for the stock market. The monthly ratio is at its highs and rising is additional evidence that the bull market in technology remains in effect. This bodes well for the QQQ to suggest that the QQQ will break through the top of the daily and weekly channel. The lower chart above is the RSI of the QQQ/SPY Ratio shows a favorable uptrend from early 2013 in effect. The RSI of the QQQ/SPY ratio is trading near its highs at 70.80. With the rally in technology since March, the small double top pattern that was forming has been negated, alleviating any sign of potential danger at this time.
Just To Sum Up: The market has been unable to have a significant breakout to the upside. The technology sector is close to breaking through the top of the short and intermediate term channels. Momentum patterns in the technology sector are favorable and could be the catalyst for an upside breakout. As long as QQQ is above 107.50, look for higher prices in the stock market. If QQQ penetrates 112.50 on a closing basis for two days it would be considered a breakout and the next leg of the advance could begin. I would love to hear from you! Any thoughts, questions comments, feedback; please call me at 1-844-829-6229 or email at bonniegortler@signalert.com


Create more wealth in your life
with these simple strategies.
As an added bonus you will also
receive BG’s Updates and Ezine

Discover how to quickly create more well-being in your life with these simple strategies.
As an added bonus you will also
receive BG’s Updates and Ezine

As an added bonus you will receive BG’s Updates and Ezine

All work listed on BonnieGortler.com is licensed under a Creative Commons Attribution - Noncommercial - No Derivative Works 3.0 Unported License.
