

5 Investing Strategies to Save Money and Grow Wealth
04/11/2024
“Price is what you pay. Value is what you get.” ― Warren Buffett
The stock market had a volatile start to the New Year, closing lower in January. Emerging markets were under heavy selling pressure, the catalyst that led to the US market changing character from euphoria, with prices going higher, to nervousness that led investors to reduce their holdings. Market volatility, measured by VIX, (a fear index) increased more than 81% in 2 weeks to a high of 21.44 on February 3, its highest level since December of 2012. Selling pressure was broad including the global markets, with emerging markets losing over 10%. Some ETFs such as Latin America (ILF), Brazil (EWZ) and Russia Market Vectors ETF (RSX) lost as much as15% through February 3rd. Fortunately, in comparison to the emerging markets double-digit losses, the S&P 500 was under pressure but the damage was -5.7% at the low point. A discouraging sign is that the decline is broadening, with more stocks showing weakness and their prices falling below 50 day moving averages. I interpret this to mean that risk is increasing going forward. Short-term support levels have been broken to the downside and could act as resistance now that the market has rallied in the past two days (February 6-7). The advance that follows this decline needs to be watched closely, to see which sectors will lead. It would be bullish if the aggressive groups such as Nasdaq 100 (QQQ), Russell 2000 (IWM) and Emerging Markets (EEM) lead the way higher. If the defensive sectors such as Utilities (XLU) Consumer Staples (XLP) and Health Care (XLV) are stronger, it would be negative, a sign that the rally will fail and the recent decline will resume.
Let’s look at what damage has taken place in the recent decline.
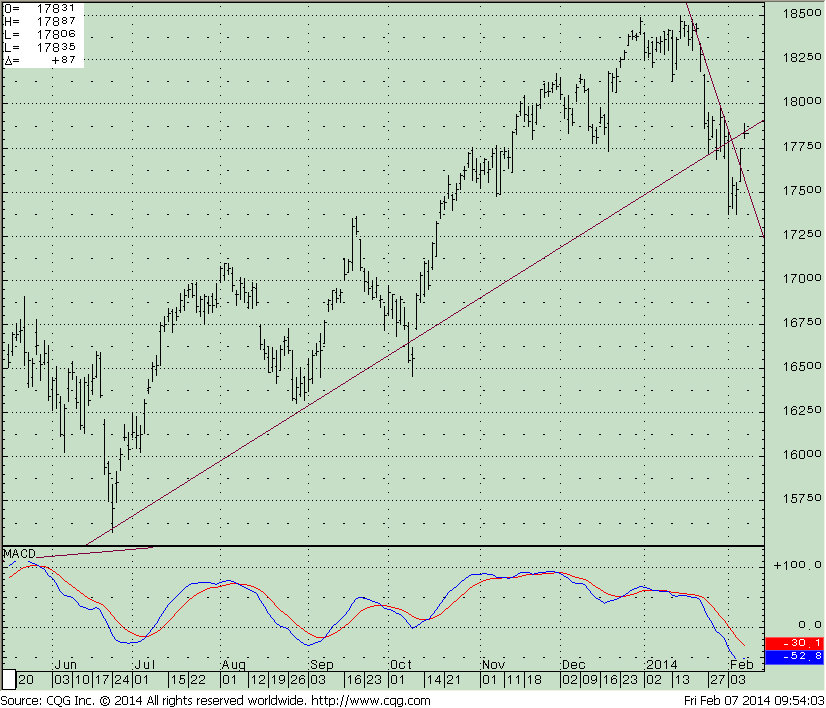
The SPDR S&P 500 ETF Trust (SPY) stopped rising, stalling in the 185 area. A decline followed after prices fell below 182.50 and started to accelerate lower with increasing volatility. The market tried to rally, but no momentum was generated and prices fell below support at 177.50. This broke the short term trend from the June 2013 lows. At the time of this writing, a reflex rally is in process and the S&P 500 is at resistance in the 177.50-179 area. (See chart above.) The emerging market area has also bounced and the Nasdaq is rising, and the Russell 2000 is rising but very unimpressive.
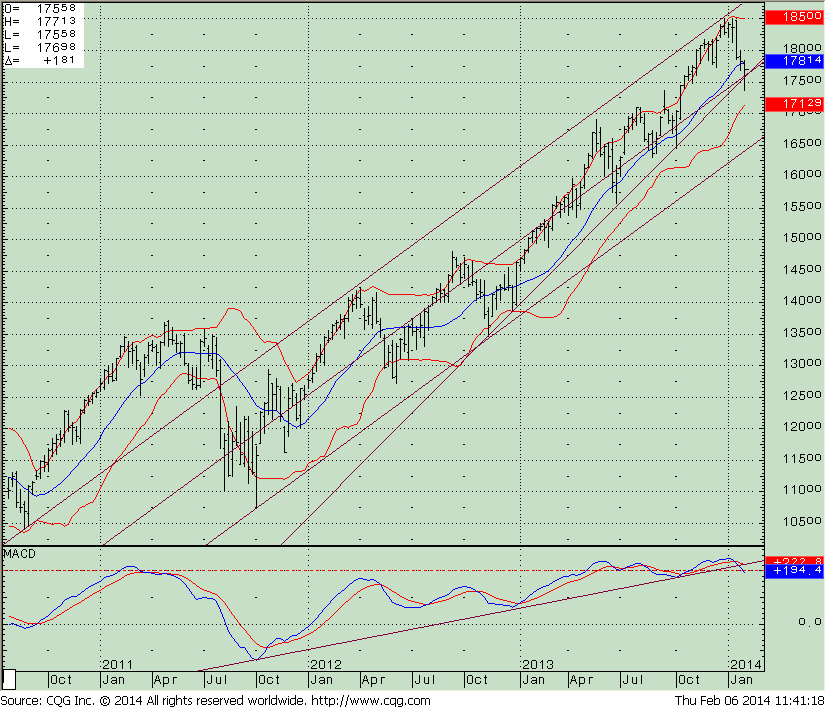
What is the Weekly Chart of the S&P 500 (SPY) Saying?
There are two important lines on the S&P 500 (SPY) weekly chart below. The channel from the lows in October 2011 is KEY, still intact as long as we are above 165.00.The other trendline is worrisome; price has broken the uptrend from October of 2012, which is disturbing. The technical indicator MACD is flashing a warning signal, rolling over, generating sell and breaking a very significant trend line from October 2011. If this reflex rally fails and the recent low of 175.17 is violated, the odds are that this recent correction, which has been contained, will accelerate and test the lower channel objective of 165.00. This should stop the decline for the technical patterns to remain favorable and keep the intermediate trend alive. If the global markets remain under pressure, institutions start to sell, and VIX rises though the recent highs then this decline could quickly get more serious and the S&P 500 SPDR (SPY) could fall to as low as 145.00.
Just To Sum Up:
The stock market had an amazing run-up in 2013, and our models remain favorable. So far in 2014 the bears have been in control. Emerging markets were hit hard, economic data was weaker than expected and the Fed continued to taper another 10 billion from its monthly asset purchase program. Technical damage is appearing with market internals losing momentum, earnings continue to disappoint traders, and profit-taking has taken place. Holding bonds rather than equities has been safer so far this year but the market is short-term oversold, so a market rally to test the recent highs is possible. On the other hand, further base-building might be necessary. For the present rally to be believable and the market to continue higher rather than extending its recent decline,
I would like to see VIX continue to fall and stabilize in the 14 – 15 area. In addition the S&P 500 (SPY) needs to trade above 180.00, and iShares MSCI Emerging Markets Index (ETF) needs to begin to lead the market higher. If the S&P 500 (SPY) trades below 170 and the iShares Russell 2000 Index (IWM) trades below 107.50 then a resumption of the decline is likely and it would be a good idea to reduce some of your exposure to the market to avoid potentially serious losses if the market were to accelerate to the downside.
I invite you to contact me with any comments or insights, and to share your own favorite charts and indicators with me. Email: bgortler@signalert.com; phone: 1-800-829-6229.
Here is a special offer to receive a
FULL YEAR OF SYSTEMS & FORECASTS NEWSLETTER
at a SPECIAL DISCOUNT – $99
This is a hypothetical result and is not meant to represent the actual performance of any particular investment. Future results cannot be guaranteed. Although the information is made with a sincere effort for accuracy, it is not guaranteed either in any form that the above information is a statement of fact, of opinion, or the result of following any of the recommendations made herein.
Readers are encouraged to meet with their own advisors to consider the suitability of investments discussed above for their own particular situations and for determination of their own risk levels.


Create more wealth in your life
with these simple strategies.
As an added bonus you will also
receive BG’s Updates and Ezine

Discover how to quickly create more well-being in your life with these simple strategies.
As an added bonus you will also
receive BG’s Updates and Ezine

As an added bonus you will receive BG’s Updates and Ezine

All work listed on BonnieGortler.com is licensed under a Creative Commons Attribution - Noncommercial - No Derivative Works 3.0 Unported License.
