

Bonnie’s Market Update 4/12/24
04/14/2024
“Know what you own, and know why you own it.” – Peter Lynch
The stock market health appears to be improving rather than getting worse. The market advance is broadening. In my May 16th article, I wrote about the stock market stabilizing and noted that aggressive sectors could fuel the US market higher. This indeed was the case, with internet, small caps, biotech,and technology having a strong month and now improving in relative strength vs. the S&P 500. The Nasdaq broke a two month downtrend line, fueled by Apple (AAPL). Internet stocks are hot again, with The First Trust DJ Internet Index Fund ETF (FDN), up over 6%, and biotech up over 9% after being a very weak sector.
What Are The Charts Saying Now?
The iShares Russell 2000 Index ETF (IWM) Daily Chart
The top portion of the Russell 2000 small cap (IWM) chart has been one of the weakest areas of the market this year. IWM has fallen 10.9% from its recent peak in March but held just above key support of 107.00 (mentioned in the May 2, 2014 newsletter). I believe this area is even more critical to hold or a big negative warning signal would be given. The IWM short term downtrend has been broken to the upside. The Russell 2000 (IWM) is again trading above its 200-day moving average. IWM fell below the 200-day moving average in April 2014 and again on May 5, 2014. Now IWM closed above which is a positive. Short term support is 111.00 coinciding with the 200-day moving average. The momentum indicator MACD in the bottom portion of the chart has now turned up from its basing formation, very close to breaking the downtrend. Aggressive traders can now buy weakness with the trend shifting from down to up so it will be easier to make money on the long side.
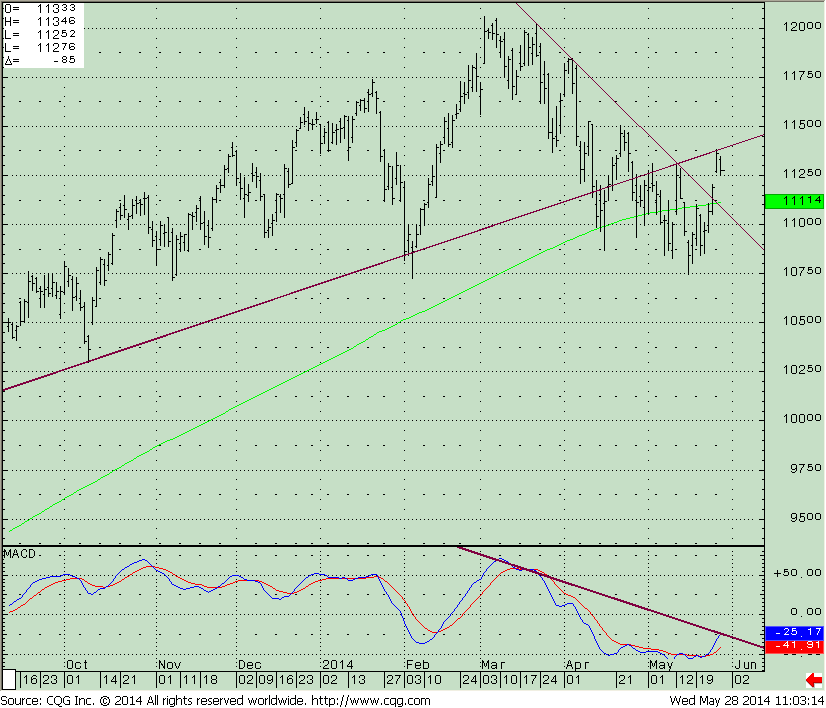 Notice how the IWM has stalled after the recent advance, just below the uptrendline that has formed by connecting the October and February lows. A break above 114.50 could excite traders to believe the recent rally, and buy small caps more aggressively which has been an out of favor area. The fi rst resistance lies at 117.50, if broken; an attempt to challenge the highs above 120.00 is a real possibility.
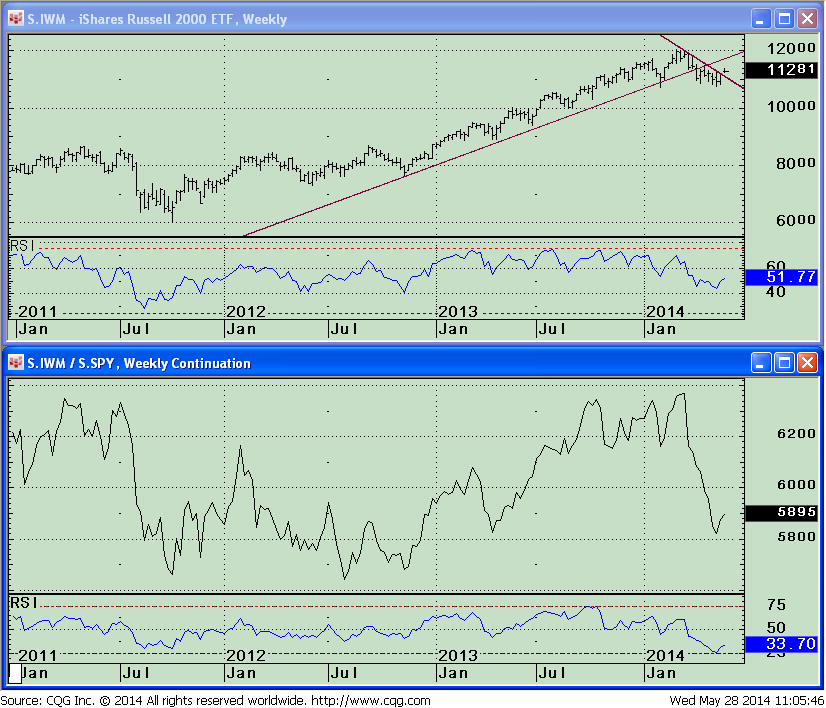
The iShares Russell 2000 Index ETF (IWM) Weekly Chart
Similar patterns from the daily chart can be seen on the top portion of the weekly IWM chart (below). With the rally this month, the down trend has been broken to the upside. The lower portion of the top chart shows a turn up in momentum based on relative strength index (RSI14).
The second (lower) chart is the weekly IWM/SPY relative strength ratio which is now rising for the first time since April 2013, indicating the IWM is stronger than the S&P 500 (SPY). The bottom portion of the chart shows RSI (14)turning up from an extreme low reading, more oversold than in September 2011 and its lowest level in the last 10 years.
 Just To Sum Up:
The stock market has been acting very well this month with the more aggressive sectors outperforming the S&P 500 and gaining in relative strength. The S&P 500 is trading near its highs, emerging markets are doing well,and the rally is broadening to the more aggressive areas of the market which keep the bulls in control. As of this writing I am a little concerned that the IWM is trading below the up-trend line on the daily chart from October 2013, and trading below the up-trend line that began in November 2012 on the weekly chart. These are key resistance lines and could be a clue that a decline might begin, because this could be a trap and this rally is temporary. Time will tell.
I continue to give the market the benefit of the doubt until the S&P 500 (SPY) falls below 180.00. I would be even more confident that a further advance will take place if we can penetrate the 117.00 area on IWM, the short term objective on the daily chart. This would indicate leadership by the small caps and not a bullish trap as the summer months move closer. An added bonus would be if market breadth continues to improve, with a high ratio of more issues advancing than declining. That would generate a buy signal from our one of our weekly breadth indicators.
Are you expecting higher or lower prices? Please share your insights with me where you think the aggressive market sectors are heading by calling me at 1-800-829-6229 or Email me at bgortler@signalert.com with your comments.
GET A FULL YEAR OF THE SYSTEMS & FORECASTS NEWSLETTER
for a SPECIAL DISCOUNT – $99
This is a hypothetical result and is not meant to represent the actual performance of any particular investment. Future results cannot be guaranteed.
Although the information is made with a sincere effort for accuracy, it is not guaranteed either in any form that the above information is a statement of fact, of opinion, or the result of following any of the recommendations made herein. Readers are encouraged to meet with their own advisors to consider the suitability of investments discussed above for their own particular situations and for determination of their own risk levels.


Create more wealth in your life
with these simple strategies.
As an added bonus you will also
receive BG’s Updates and Ezine

Discover how to quickly create more well-being in your life with these simple strategies.
As an added bonus you will also
receive BG’s Updates and Ezine

As an added bonus you will receive BG’s Updates and Ezine

All work listed on BonnieGortler.com is licensed under a Creative Commons Attribution - Noncommercial - No Derivative Works 3.0 Unported License.
