

5 Investing Strategies to Save Money and Grow Wealth
04/11/2024
 The stock market continues its roller coaster ride. A broad sell-off occurred during the first half of October, but the market has come back with vengeance the second half of the month. The sharp decline happened after some of the key indices broke short term support levels, and some long term trend lines were violated generating extreme pessimism. The market responded with a huge reflex rally.
In the last newsletter September 17, 2014, I had identified some key areas of where the market needed to hold. The S&P 500 (SPY) fell from 201.82 to 181.92, 9.86%, not quite reaching the downside objective of 178.00. The XLE fell from 94.84 to 77.51 holding above the channel objective of 75, bottoming at 77.50. The Nasdaq 100 (QQQ) held its major support almost perfectly holding 90.00, trading at 90.24, its low for the decline. The recent advance has been much more than a rally back to old resistance levels. Many times with sharp declines there is a quick test of the lows followed by a safer entry 3-6 weeks later. This time prices rebounded sharply, making a V shaped formation with no test of the lows. With the severity of the decline the stock market got very oversold, and now has changed again to the market being in an overbought condition. Fear has disappeared despite the moves of more than one percent on a regular basis shrinking the CBOE Volatility Index (VIX) from 24.64 on October 13, 2014 to 15.00.
Where Do the Charts Stand Now?
Daily iShares Russell 2000 Index (ETF) IWM with its MACD
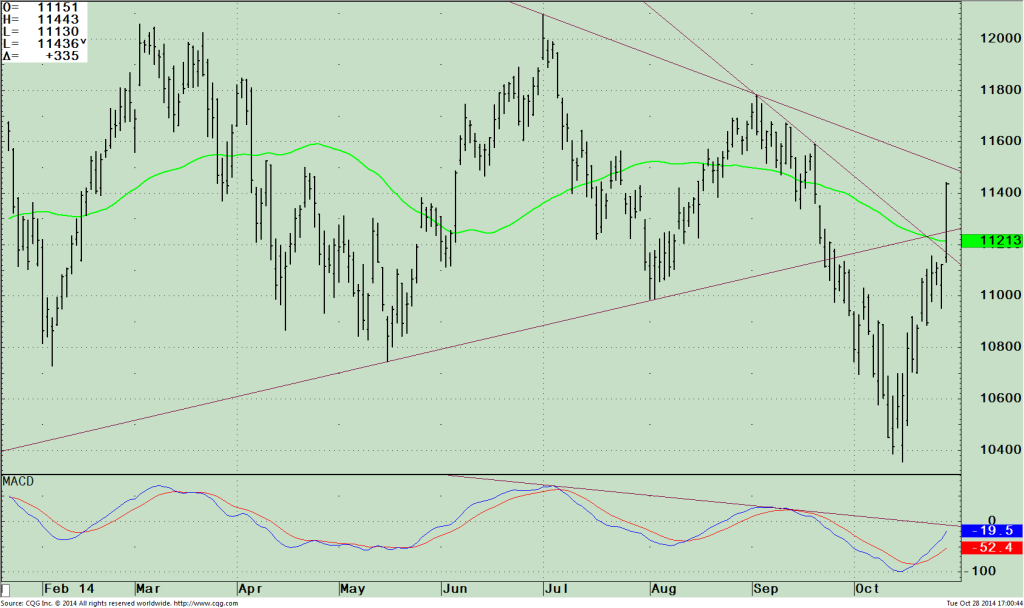 Small caps have been out of favor, under performing the S&P 500 this year, but could be the next catalyst to signal higher prices ahead. The iShares Russell 2000 Index ETF (IWM) peaked July 1, 2014, fell below its 200-day moving average, bottomed in August, and failed to take out the highs in September, giving a warning of potential market weakness ahead. IWM broke its short term trend when it fell below 111 from the secondary high of 117.80 on 09/03/14. The decline accelerated after penetrating 110.00, falling 12.11 % to its intraday low of103.54 on 10/ 15/14. On the reflex rally the IWM stalled at the resistance zone from 110-112 for a few days and then broke above the line closing at 114.35 on 10/28/14,just missing breaking the daily down trend from the peak made on 07/01/14 of 120.97. A break above this level would confirm higher prices ahead and would be considered short term bullish. If we could break 116, investors might be more willing to take on the risk.The lower part of the chart is the momentum indicator MACD. After peaking in July 2014 and then forming a secondary peak in September, MACD has now turned up from an oversold condition (below 0), now very close to breaking the down trend from the peaks in September and October. This would be bullish and be another confirmation of higher prices.
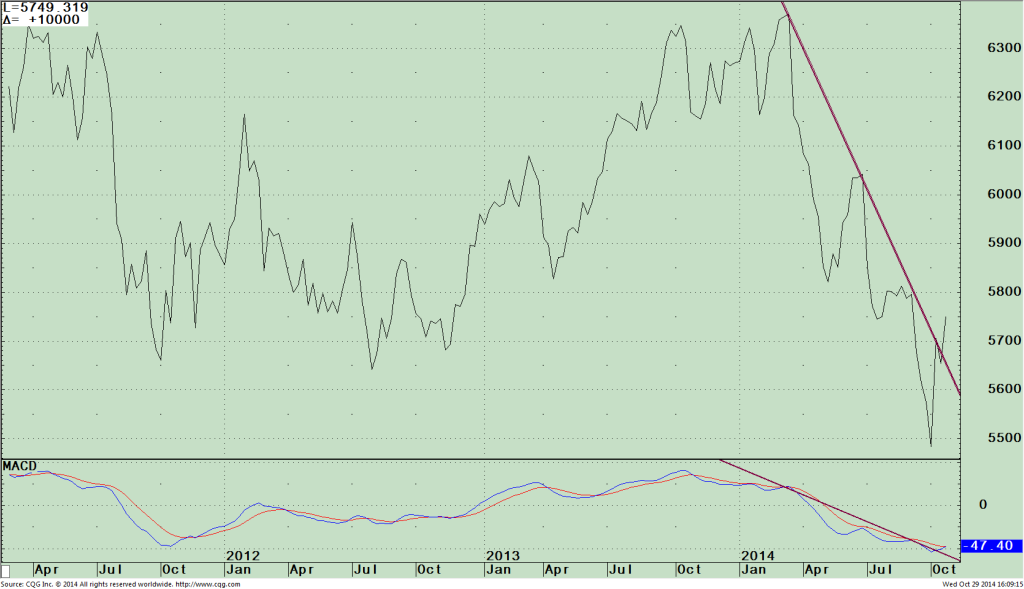 Chart 2 Weekly Relative Strength Russell 2000 and S&P 500 ETF with its MACD (IWM / SPY)
The top half of the chart to the right is showing a change in leadership for the intermediate term between the Russell 2000 and S&P 500. A rising line means the iShares Russell 2000 Index ETF (IWM) is stronger. A falling line means the S&P 500 (SPY) is stronger. Small caps peaked early in 2014, they had a few unsuccessful rally attempts this year bu thave failed. A change has taken place. Notice the recent break inthe downtrend. This is suggesting that the iShares Russell 2000 Index (ETF) IWM could now outperform the S&P 500 and lead the market higher during the next advance. The lower chart is a MACD on the relative strength ratio IWM/SPY which is confirming the change in leadership which could very well be the next catalyst to the advance.
Just to Sum Up:
The bulls and bears battled during the month of October. First a decline, then there was a reflex rally that was stronger than expected, leaving the bulls in control. The quick sharp decline was a needed pullback that has created the potential to take advantage of financial opportunities, especially in the small cap sector that now has favorable chart patterns and favorable seasonality. Additional short-term volatility is expected and there is still a chance there could be a test of the recent lows later this year, but for now the market appears to be out of major danger of a real serious decline. Selling pressure has subsided, market breadth has improved, new lows have contracted, international markets have mostly stabilized and small caps are now leading in relative strength, all positive signs. The market has made it through the volatile months of September of October and now favorable seasonality is here. There is better value and less risk at this time to take positions in the small cap sector, the iShares Russell 2000 Index (ETF) IWM for some of the cash that you have or might have accumulated on the decline.


Create more wealth in your life
with these simple strategies.
As an added bonus you will also
receive BG’s Updates and Ezine

Discover how to quickly create more well-being in your life with these simple strategies.
As an added bonus you will also
receive BG’s Updates and Ezine

As an added bonus you will receive BG’s Updates and Ezine

All work listed on BonnieGortler.com is licensed under a Creative Commons Attribution - Noncommercial - No Derivative Works 3.0 Unported License.
