

Bonnie’s Market Update 4/12/24
04/14/2024
The Nasdaq has been stronger than the S&P 500 this year. In the 02/6/15 newsletter, I wrote that the intermediate momentum patterns of the Power Shares QQQ Trust (QQQ), an exchange traded fund (ETF) based on the Nasdaq 100 Index, warned of a possible decline if prices fell below 99.36, which didn’t happen. Instead, QQQ broke the weekly downtrend by penetrating 105.00 and made a new all-time high of 109.42 on March 2. The bounce to new highs was not that impressive, displaying only light volume on up days of less than 2 billion shares traded on Nasdaq and only one billion on the New York Stock Exchange Index with less than 200 new highs on both indexes.
The Nasdaq has lost its leadership compared to the S&P 500 (SPY) on a short term basis (daily chart not shown). If the Nasdaq doesn’t regain its leadership this would not be bullish, decreasing the likelihood of the market having a substantial rally going forward. The market once again appears to be at a critical time, and bears watching, especially if the market were to stall and fail to take out February’s highs before the end of March.
PowerShares QQQ Weekly Price and Trend Channels (top), and 12-26-9 week MACD (bottom)
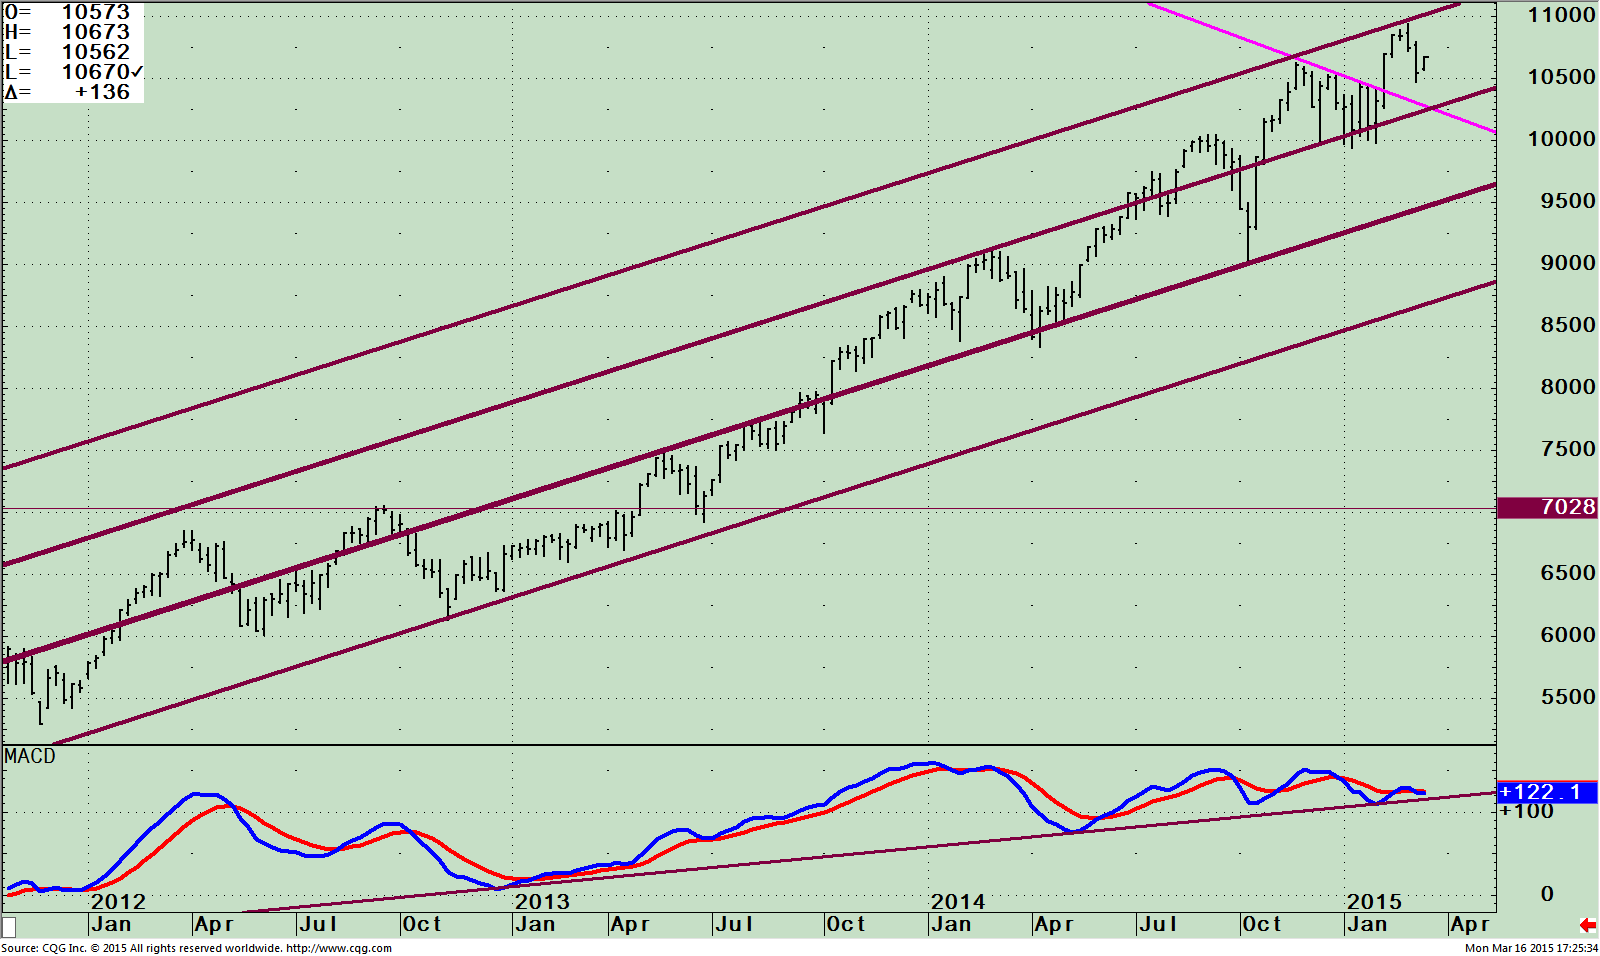 The top part of the chart is the Power Shares QQQ Trust, which holds 100 of the largest domestic and international non financial companies listed onthe Nasdaq stock market based on market capitalization.
The top holdings as of 03/16/2015 are Apple (AAPL) 14.74%, Microsoft (MSFT) 6.89%, Google Inc. (GOOG) 3.79%, Facebook Inc.(FB) 3.49 and Amazon AMZN 3.48%. Apple, the largest holding, peaked earlier this month with a high of 133.60 on 02/17/15. Support is at 120 followed by 111.00. With Apple such a largeholding in the Nasdaq 100 (QQQ), if Apple doesn’t make a new high and continue higher then don’t expect the QQQ to regain leadership over the S&P500 (SPY).Notice how the QQQ made a high on 03/02/15 surpassing its high on 11/26/14, at 106.24, stopping at the top of the weekly channel that acted as resistance.
The lower portion of the chart is MACD, a momentum oscillator. The oscillator is falling even with this latest rally, showing weakening momentum, not a good sign. A negative divergence is in place, (higher high in price with a lower low in MACD) along with a clear triple top in place, a very bearish pattern. The QQQ made a new high 03/02/15, 11/28/14 and 09/22/14 with MACD having lower peaks). The uptrend made by MACD from January 2013 remains intact but is very close to being broken to the downside. If this MACD trend line is violated then I would expect further weakness in QQQ to take out the recent low and test the 01/1615 lows of 99.36. Next support would be towards the lowers channels at 95.00 and 88.00.
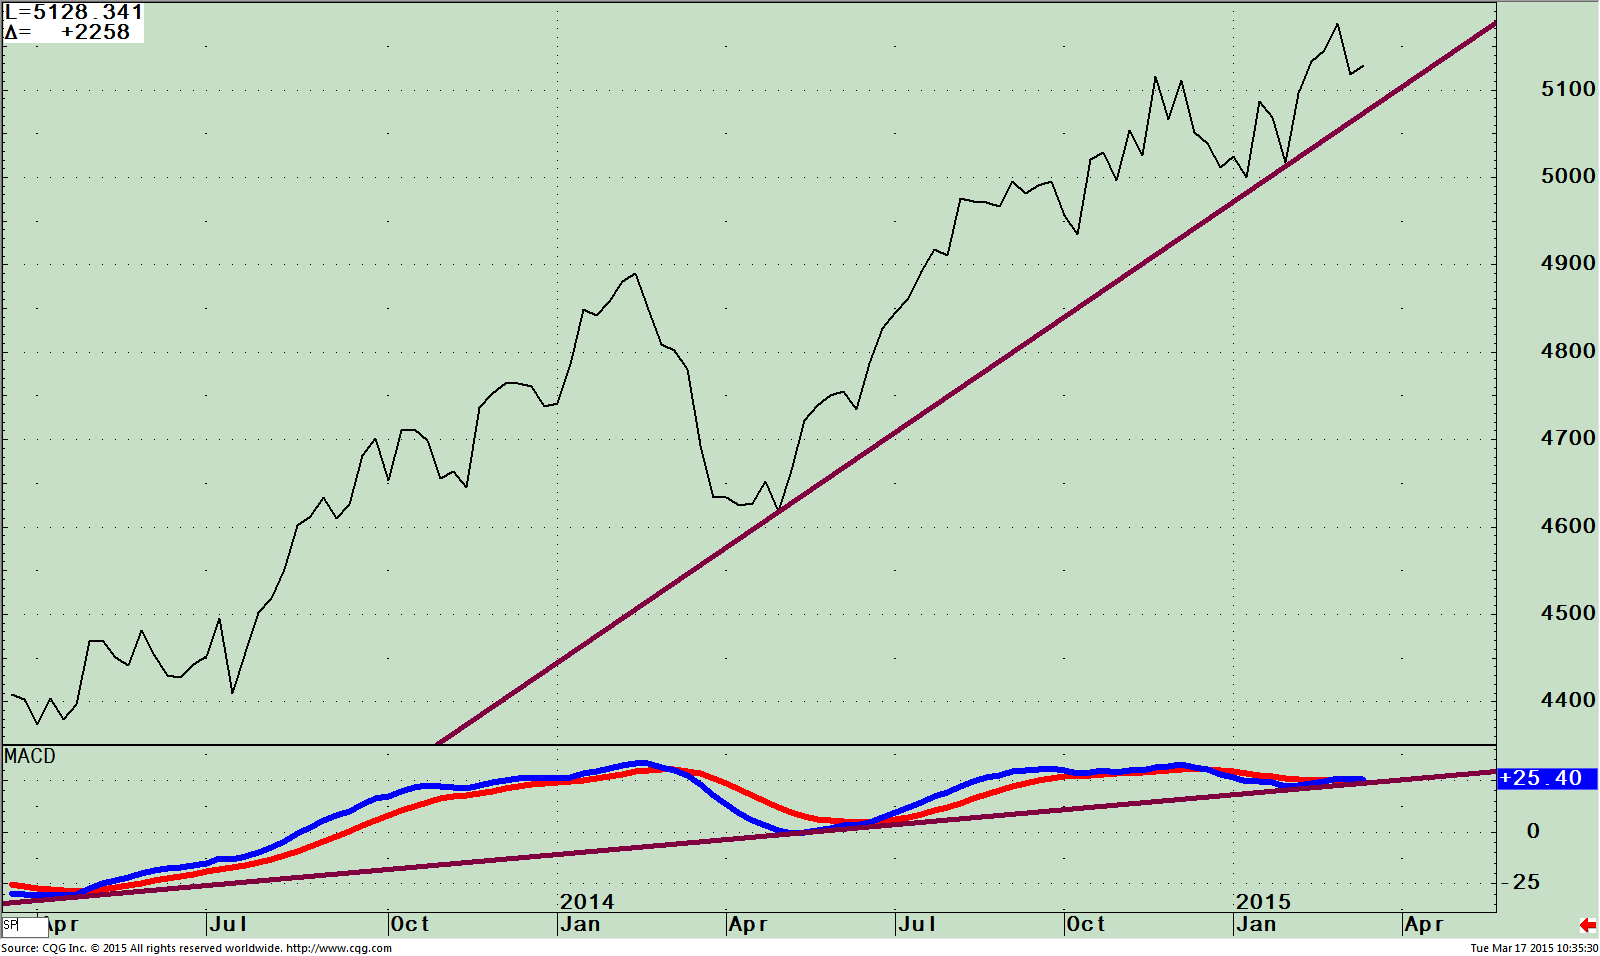
Weekly QQQ/SPY ratio (top) and MACD of the QQQ/SPY ratio (bottom)
 With the daily chart sometimes too sensitive to daily swings causing whipsaws, I like to keep looking for a change in trend using the weekly charts to confirm a trend change.
When the Nasdaq (QQQ) is stronger thanS&P 500 (SPY), this normally bodes well for the stock market.
The top portion of the chart shows that relative strength appears to be shifting from favoring QQQ to favoring SPY, indicating a less favorable overall market climate. A turn down in the relative strength ratio of QQQ/SPY has taken place,but so far the up-trend from April 2014 remains in effect. If the trend line is violated expect the Nasdaq to continue to be under more pressure than the S&P 500.
The MACD of the QQQ/SPY Ratio (lower chart) is worth watching. Even with the recent highs made in the Nasdaq momentum is weakening, warning there is a good possibility that the high in QQQ/SPY has been made and that the overall leadership has changed to continue to favor SPY over QQQ. This would portend slower gains in all stocks, not just the Nasdaq.
Just To Sum Up how the Nasdaq 100 Is Losing its Relative Strength:
The Nadaq100 has stalled near its upper longer term channel and has turned down. Our models remain bullish which suggests that risk will be contained if a decline begins. Chart patterns are disturbing with a triple top in MACD clearly showing decreasing momentum. It would be bullish if the QQQ closes above 110.00 for at least 2 days and the Nasdaq rises more than the S&P on up days and falls less than the S&P 500 on down days. If the QQQ takes out the recent low of 104.68, then a test of the 01/16/15 low of 99.36 is a real possibility.
Review your holdings in your portfolio. If you are overweight with stocks in technology sector, it’s a good idea
to take some profits now, and raise some cash if the recent lows are violated and a decline was to start sooner
rather than later.
I invite you to share your insights by calling me at 1-844-829-6229 or Email me at BGortler@Signalert.com with
your questions or comments.


Create more wealth in your life
with these simple strategies.
As an added bonus you will also
receive BG’s Updates and Ezine

Discover how to quickly create more well-being in your life with these simple strategies.
As an added bonus you will also
receive BG’s Updates and Ezine

As an added bonus you will receive BG’s Updates and Ezine

All work listed on BonnieGortler.com is licensed under a Creative Commons Attribution - Noncommercial - No Derivative Works 3.0 Unported License.
