

Bonnie’s Market Update 4/12/24
04/14/2024
Originally published in Systems and Forecasts Newsletter Jan 24, 2014
“Be Fearful When Others Are Greedy and Greedy When Others Are Fearful” ― Warren Buffett
The stock market had a small amount of profit taking early on in January, but once again the market was resilient, it stabilized and reversed back up with the S&P 500 making a slight new high. In the last newsletter, 12/20/13, I wrote that the long term trend was up but technical indicators were overbought in many market averages which made it possible that profit taking would take place in market-leading ETFs such as SPY, IWM, QQQ and XLF.
For this article I looked for weak and oversold market averages on monthly charts by using one of my favorite technical indicators–RSI (Relative Strength Index)–to identify what appears promising buy areas from where rallies develop and could gain visibility from investors when prices stabilize and reverse. The RSI was developed by J. Welles Wilder Jr. It can be used on individual stocks, ETFs or other stock market vehicles. The oscillator ranges from 0 – 100. The RSI Index is considered overbought at 70 and oversold at 30. Extremely high or low readings are potentially early signs of a pending market tops or market bottoms.
Although it was not an easy task to find market averages that are oversold on a long term basis because the stock market has been trending higher since 2009. I found four ETFs that intrigued me. These ETFs were close to being oversold as measured by RSI but I think they could be good investment opportunities in 2014: Silver, (SLV), Gold (GLD), Brazil (EWZ) and 20+ year Treasury Bonds (TLT). Gold and silver were hit hard in 2013, emerging markets lagged the US market, and the bond market had a negative total return for the first time since 1999.
Where do we stand now on the long term monthly charts of some of the key ETFs?
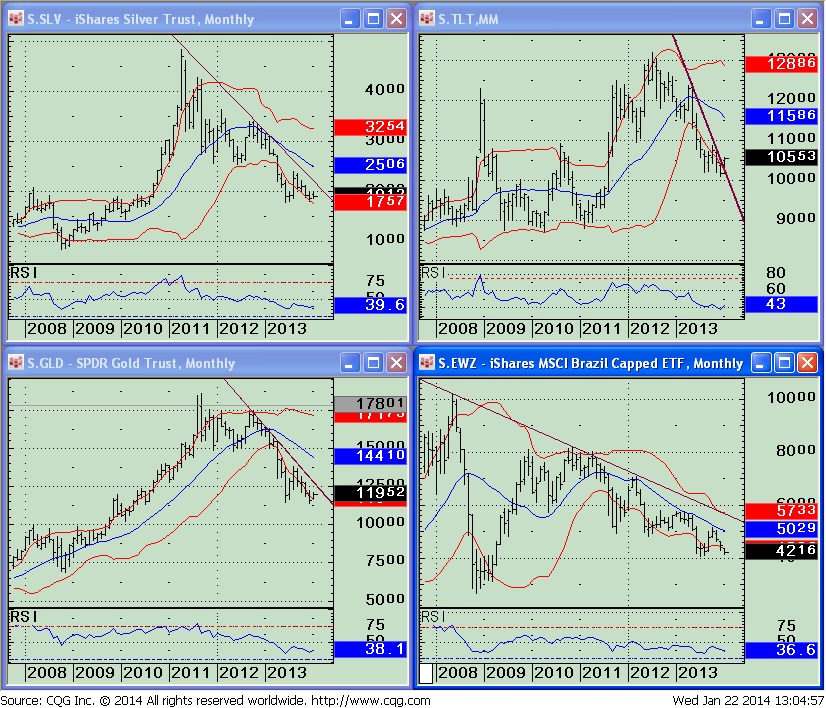
All four charts on December 31, 2013 have growth potential because they have been out of favor from investors. They are not fully oversold by being below 30, but they are below 40 and have intriguing patterns.
Top Left Chart–SLV Monthly: The iShares Silver Trust (ETF) SLV, which tracks silver bullion, peaked in April 2011 at 48.35. A rally attempt from the lows in June 2012 failed in September
2012 and was unable to gather much momentum to the upside until July of 2013. Once again the rally failed, selling pressure occurred and we are now trading near its low of 17.75. SLV
is best for aggressive traders, not for conservative investors, because it is very volatile. RSI is 38.68 as of December 2013 (not quite yet below the oversold level of 30) but has turned up. Aggressive traders could buy now if they want to take a chance that the bottom is in and don’t want to wait until the down trend is broken. I do suggest a tight stop of 5% below your purchase just in case the final bottom is not in.
Bottom Left Chart–GLD Monthly: SPDR Gold Shares ETF (GLD) tracks the price performance of the gold bullion. The monthly RSI reading December 2013 is 35.59, very close to its
lowest monthly reading since the ETF began in 2004 when it reached 33.67 June 2013. With the recent rise in GLD so far in January, RSI has formed a rising double bottom, a bullish charting formation.
Top Right Chart—TLT Monthly:
The iShares Barclays 20 Year Treasury Bond ETF (TLT), is a long term Treasury Bond index with bond maturities of 20 years or more that are denominated in US dollars. When long term
interest rates fall TLT rises. The monthly December 2013 RSI reading is 37.93, the lowest reading since 2003 when the ETF began. Prices have fallen from a peak of 132.21 to the low of 101.17 since July 2012. It appears that a bottom has been made; long term rates have stabilized and could move lower going forward.
Bottom Right Chart—EWZ daily:
The iShares MSCI Brazil Index ETF (EWZ) started in July 2000.
The ETF measures the broad-based equity performance in Brazil. EWZ has been one of the weaker emerging markets. It has been in a down trend since the peak of May 08, although with the momentum of the decline getting smaller. The December 2013 monthly RSI reading is 38.96. In July of 2013 RSI made a low of 33.86 the lowest level since 2004. A potential rising double
bottom will occur if prices hold and turn up. This would be bullish.
Just to sum up:
With the stock market being resilient as it has, the long term trend up and no real decline taking place there are not many areas of the market where prices have been weak. At the time of this writing the market is falling, profit taking by traders and investors is taking place. Traders are a bit jittery knowing the next FOMC meeting is January 28th & 29th, less than a week away. It appears money is moving into long term treasuries, (TLT), Gold (GLD) and Silver (SLV). Brazil (EWZ) is falling sharply with other emerging markets. When investors want to take more risk (EWZ) could potentially be an area that has a large growth potential based on the position of the monthly RSI pattern.
Our models remain favorable and the market internals have been good and support levels remain in-tact so I continue to give the US equity market the benefit of the doubt. I would like to see the S&P 500 (SPY) hold daily support at 170 mentioned in the December 20, 2013 newsletter and the iShares Russell 2000 Index at 107.50.
I invite you to contact me with any comments or insights, and to share your own favorite charts and indicators with me. Email: bgortler@signalert.com; phone: 1-800-829-6229.
Here is a special offer to receive a
FULL YEAR OF SYSTEMS & FORECASTS NEWSLETTER
at a SPECIAL DISCOUNT – $99
This is a hypothetical result and is not meant to represent the actual performance of any particular investment. Future results cannot be guaranteed.
Although the information is made with a sincere effort for accuracy, it is not guaranteed either in any form that the above information is a statement of fact, of opinion, or the result of following any of the recommendations made herein. Readers are encouraged to meet with their own advisors to consider the suitability of investments discussed above for their own particular situations and for determination of their own risk levels.


Create more wealth in your life
with these simple strategies.
As an added bonus you will also
receive BG’s Updates and Ezine

Discover how to quickly create more well-being in your life with these simple strategies.
As an added bonus you will also
receive BG’s Updates and Ezine

As an added bonus you will receive BG’s Updates and Ezine

All work listed on BonnieGortler.com is licensed under a Creative Commons Attribution - Noncommercial - No Derivative Works 3.0 Unported License.
