

Bonnie’s Market Update 4/12/24
04/14/2024
“Expect the best. Prepare for the worst. Capitalize on what comes.” Zig Ziglar
The stock market decline from early October seems like a distant memory with stock market indices such as S&P 500 and NASDAQ at or near their highs for the year. Since the October 15th low the S&P 500 has had virtually no pull back. Technical indicators which were oversold are now extended in the short term. Historically after a sharp decline, a test of the old lows occurs 3-6 weeks later. The market is now within this time period for a test to take place. At any time a small correction could happen and this would be a buying opportunity to take advantage of since we are in a favorable seasonal period.
Sector selection this year has been important for investors this year. Internationals, small caps, oil, gold, and silver have lagged. Technology, finance, real estate, and defensive sectors such as consumer staples, healthcare, and utilities have been leading the stock market higher. Small caps have been out of favor unable to be a catalyst to signal higher prices ahead like I thought could happen, even though the Russell 2000 Index (IWM) broke the daily down trend from June’s high through the September high.
Another laggard but popular area of the market this year is the internet sector, (FDN) which is weaker than the S&P 500, only up 4.6% for the year. I find it very useful to use this index as a guide for how much risk investors are willing to take and for the short term direction of the market.
What Do The Charts Say?
Social media, especially Twitter and Facebook, is a growing industry and happens to be a great passion of mine. Technology has improved quickly over the years expanding the experience of the user and increasing the popularity of these stocks. Investors have large profits in the sector although volatility and risk are high. Investing in one single stock has higher risk than having a more diversified portfolio of internet stocks, I recommend using the First Trust DJ Internet Index Fund ETF (FDN). As of November 10, 2014 the top holdings of the FDN consist of Information technology 72.18% and consumer discretionary 22.45% along with small portions in financials and health care. The largest holding is Facebook (FB) with 9.76%. Other top holdings are Amazon.com, (AMZN) 7.92%,eBay, (EBAY) 6.15%, The Priceline Group Inc. (PCLN) 5.71% and Yahoo Inc. (YHOO) 5.69% totaling 35.23%.
First Trust Dow Jones Internet ETF (FDN) Weekly
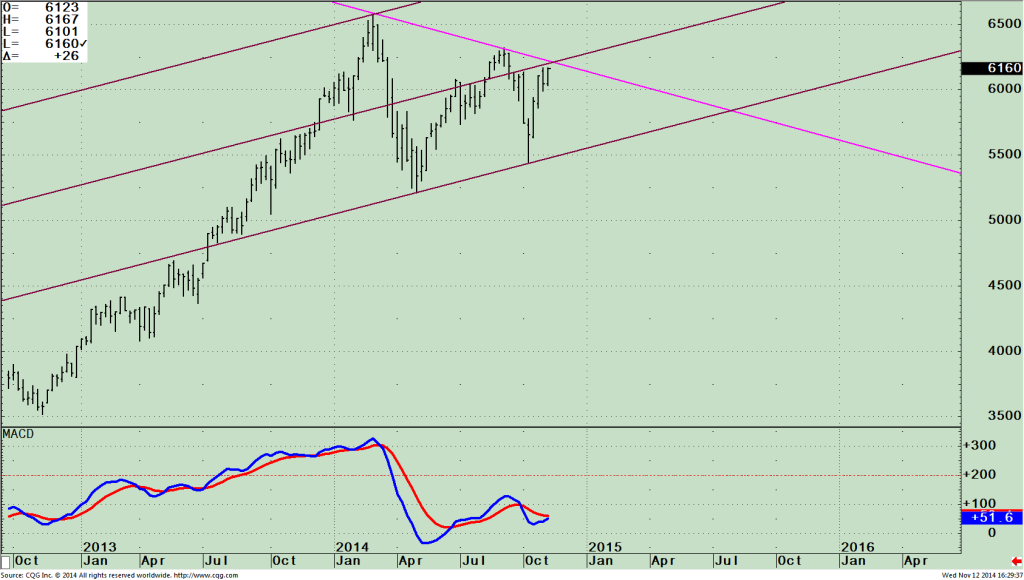
In the top chart,to the right, the price of FDN is making lower highs from early January and a down trend is in effect. If price fails to make a higher high this would suggest any rally in the overall market could be suspect with traders not wanting to commit to invest in areas that are more speculative.
I also think instead of being the start of a broader rally into the end of the year with more sectors participating in the advance, the overall market could first have to test the recent lows. If the internet sector could break out to the upside over 64 this could be the catalyst to ignite the fourth quarter advance.
The bottom portion of the chart is MACD, a technical indicator which measures momentum. MACD is oversold, in a favorable position. It would be bullish to see prices turn up from here along with momentum to continue to turn up and break its downtrend.
Facebook, Inc. (FB) Weekly
I am concerned with the recent action in Facebook (FB).
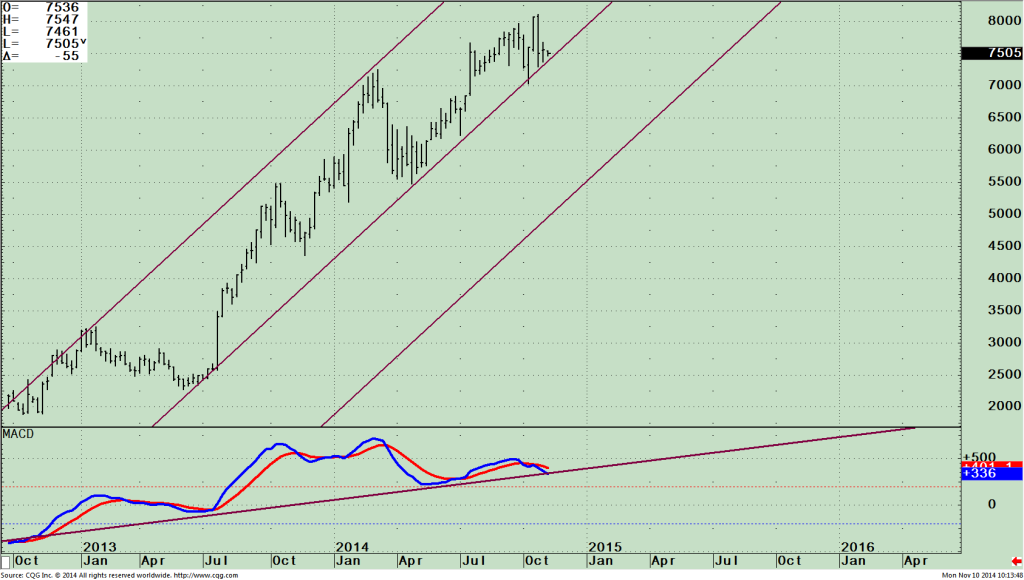
Facebook is the largest holding in the internet index. Many investors have large holdings and profits in the stock.
The top portion of the chart shows FB is at a key area. FB made a new high on October 28th at 80.77, now 7.9% off of its high trading at 74.38. The weekly trend has been up since July 2013 but if prices don’t hold here, then the uptrend could be broken which would be negative for the sector and potentially the overall market.
The lower portion of the chart is MACD
which concerns me. A negative divergence has formed with price making a high but MACD is failing to confirm the high. So far the uptrend in momentum is intact but this could change quickly. Downside channel objective is 57.50. Investors who have large holdings might consider taking some profits off the table if the stock falls below 72.50.
If you still like the sector as a whole you could lighten up in Facebook and buy FDN instead.
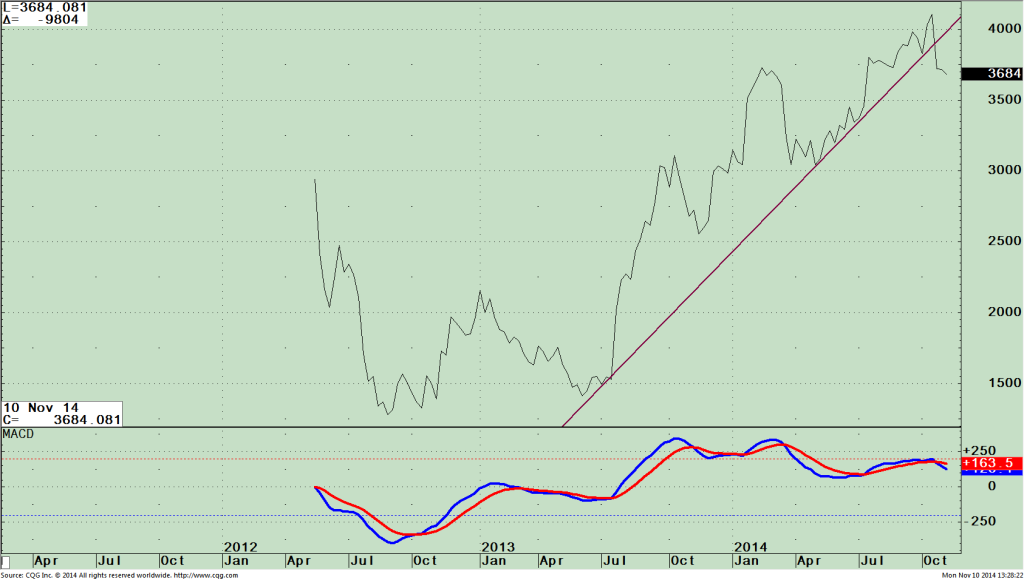
Facebook, Inc. (FB) / SPDR S&P 500 ETF (SPY), Weekly Relative Strength
The chart to the right is the relative strength between Facebook and S&P 500 (FB/SPY). When the line is rising it means FB is stronger. When the line is falling, SPY is stronger. Notice the recent trendline break of the uptrend from July on the top portion and on the lower portion of the chart MACD is confirming weakness generating a sell. Now is not the time to be overly invested in Facebook.
Just to Sum Up
High risk speculative areas of the market such as the internet sector are giving technical warning signals and could be the next area where a significant decline could occur when investors decide it’s time to take profits. Keep an eye if internet stocks start to fall, diverging from the S&P 500 which is now leading in relative strength.
If you own individual stocks in this sector, it’s a good idea to have an exit strategy of where to sell. If FB falls below 72.50, this could be the start of overall weakness in the sector. With negative patterns developing on the intermediate and long term charts it’s time to lower the expectation of what gains could be from here in the internet sector. If you do want to stay invested in this sector, instead of risking the investment in one single stock, invest in the First Trust Dow Jones Internet ETF (FDN) index, so you will have less risk but would still have exposure to the internet area. Keep in mind the stock market is now in the 3-6 week window where a short term decline could occur at any time.
I invite you to call me if you would like to review your investments at 844-829-6444 or E mail me at
bgortler@signalert.com.
 image source: www.forum.srilankaequity.com,accessed 11/13/2014


Create more wealth in your life
with these simple strategies.
As an added bonus you will also
receive BG’s Updates and Ezine

Discover how to quickly create more well-being in your life with these simple strategies.
As an added bonus you will also
receive BG’s Updates and Ezine

As an added bonus you will receive BG’s Updates and Ezine

All work listed on BonnieGortler.com is licensed under a Creative Commons Attribution - Noncommercial - No Derivative Works 3.0 Unported License.
