

Bonnie’s Market Update 4/12/24
04/14/2024
The stock market reacted well with the S&P 500 (SPY) challenging the top of this year’s trading range after the May 2015 employment data was released, but prices failed to follow through to the upside, while still holding well above the March lows. My prediction is that prices will eventually break out from the trading range. Once the trading range is broken, the move will be in the direction of the break and most likely will be significant. Trading action is dull (I never like to sell a dull market short). The S&P 500 (SPY) 25 day average trading day range is 0.52%, and VIX (a measurement of fear) is at 13.00, a low reading.
Market tops take a long time to form. Money is rotating in and out of sectors with transports (IYT), utilities (XLU), and 20 Year Treasury Bonds (TLT) all out of favor and under pressure. Telecom (IYZ), real estate (IYR), and biotechnology sectors also have not been acting well as of late, losing their relative strength compared to S&P 500. The good news is many intermediate and longer term chart uptrends remain intact, which is bullish for the overall market. For now, our models are favorable, the global markets’ chart patterns show improved relative strength and continue to support the US market. Also the emerging markets (EEM) monthly chart looks extremely favorable, with a huge consolidation going back to 2011 suggesting plenty of opportunity for a substantial advance.
What Chart Is Key Now?–Weekly S&P 500 (SPY) and MACD (Bottom)
The top chart is the weekly S&P 500 (SPY) ETF, showing an uptrend from the lows in November 2012, except for one penetration in October 2014, which reversed very quickly to the upside. This year, SPY has moved higher, challenging the highs and then retreating from them.
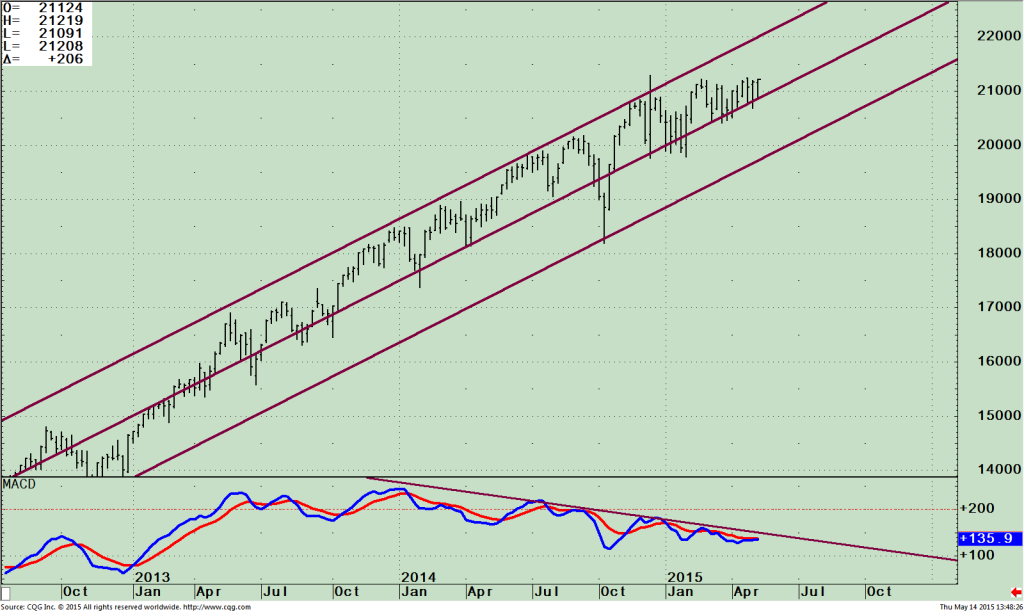
A tight trading range of 7.4% from its high to low has formed. A low was made on 02/2/15 of 197.86, with a high on 04/27/15 of 212.48. Support in the SPY 500 (SPY) is 204 and resistance is 213. A close above or below these levels for 2 days would be considered significant with more follow through in that direction. Upside objectives are 220, followed by 230.00. Downside objectives 197.00 followed by 188.00. The bottom chart, MACD, (a momentum indicator) continues to show weakening momentum, as price has moved higher since 2014. This is a bit disturbing and needs to be watched, to see if it can break the downside trendline or if the momentum continues to fail. If the S&P 500 breaks to the upside and MACD confirms the breakout, this would be bullish for the intermediate term, negating the unfavorable declining pattern that has formed. The daily chart (not shown) is very close to breaking its momentum down trend from December 2014 if prices move higher now.
Just to Sum Up:
The trading range continues in the S&P 500 (SPY) while other sectors are weakening compared to the S&P 500. Sector and group rotation is going on as the market is quiet and dull with an occasional one day wonder. The prospect of higher interest rates in the upcoming months remains a concern for investors with the 10 year bond yields near their highs of 2015 that could cause further choppy action in U.S. equities and bears watching. The jury is still out on the next big move the S&P will make therefore following the market action of the S&P 500 (SPY) as a guide is the best. A break above 213 on the S&P 500 (SPY) would suggest higher prices going forward, while a break below 204.00 would suggest a market decline of more significance
could be under way.
With our models still favorable and the international markets strengthening and supporting our market I give the benefit of the doubt to the bulls and look for higher prices ahead potentially 220, followed by 230.00 on the S&P 500.
Just in case the market moves to the downside, it’s best not to leave your investments unattended in case momentum patterns weaken instead of strengthening as expect. Keeping a watchful eye and having a plan with an exit strategy in place will serve you better. If interest rates rise sharply quicker than expected, this could be the next catalyst to the next significant market decline instead of higher prices and a breakout to the upside.
I invite you to share your stock market insights, questions or comments by calling me at 1-844-829-6229 or Email me at bgortler@signalert.com.


Create more wealth in your life
with these simple strategies.
As an added bonus you will also
receive BG’s Updates and Ezine

Discover how to quickly create more well-being in your life with these simple strategies.
As an added bonus you will also
receive BG’s Updates and Ezine

As an added bonus you will receive BG’s Updates and Ezine

All work listed on BonnieGortler.com is licensed under a Creative Commons Attribution - Noncommercial - No Derivative Works 3.0 Unported License.
